Basic HTML Version


www.geotechnicalnews.com
Geotechnical News • September 2013
29
GEOTECHNICAL INSTRUMENTATION NEWS
(ADOT&PF) and the University of
Alaska Fairbanks (UAF), installed the
INC500 in September 2012. Where
drilled, FDL-A was fairly homoge-
neous, mostly consisting of silty sand
with gravel. The boring in which the
INC500 was installed intercepted
white mica schist bedrock at 26.4
m below ground surface (bgs). We
attached two vibrating wire (VW)
piezometers and a thermistor string to
the outside of the guide casing, and
backfilled the boring using cement-
bentonite grout.
The INC500 device consists of 2.4-m
long modules that contain a series of
MEMS-based accelerometer sen-
sors. In a standard module, these
biaxial sensors are located every
30.5 cm, along with a temperature
sensor that has a reported accuracy
of ±1.7°C (GEODAQ, 2010) and is
not calibrated unless specified by the
customer. The modules are joined by
underwater electrical connectors with
connections that are stiffened by a
coupler assembly to give the entire
length a uniform rigidity. Additionally,
three to four centralizers are mounted
along the length of each module (see
Figure 1). Each centralizer contains
four stainless steel wheels that are
designed to guide and orient the
device within a slotted guide casing.
Because of its modularity, an INC500
device can be lengthened or shortened
to accommodate the geometry of a
given installation.
For this installation, the INC500
device consisted of 12 modules and
was installed to 30.5 m bgs (see Figure
2). Due to the difference between the
casing and assembled M-IPI lengths,
approximately 0.5 m of the upper-
most INC500 module was above the
ground surface within the casing. The
guide casing was filled with propyl-
ene glycol to prevent freezing of any
water that might
accumulate due to
condensation and/
or leaks. All instruments were wired
into an automated data acquisition
system (ADAS) powered from a bat-
tery bank recharged by a solar panel. A
data logger within the ADAS recorded
measurements every six hours.
Results and Discussion
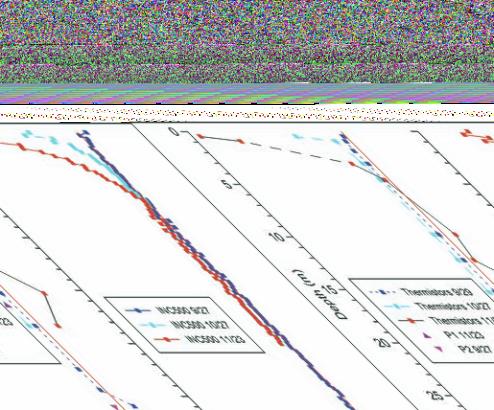
Figure 3 contains plots of cumulative
displacement from the M-IPI device.
The data were corrected using vector
summation (Cornforth, 2005), and
for the cumulative change in depth of
the sensors. Originally at 0.5 m above
the ground surface, horizontal move-
ment within the shear zone pulled the
M-IPI down within the casing to 0.1
m bgs, correlating well with visual
observations. These adjusted readings
indicated movement within a well-
developed shear zone between 20.2
m and 22.8 m bgs. The M-IPI device
recorded at total of 79.2 cm at the
surface in 31 days.
On October 24, the M-IPI began to
record apparent “retrograde motion”
upslope between 20.4 m and 21.4 m
bgs (see Figure 4a). Considering the
Figure 4. Evidence of failure of the INC500 at FDL-A. (a)
Apparent “retrograde motion” began at 6:00 on October
24, with major “retrograde motion” at 0:00 on Octo-
ber 25. (b) The lobe above the shear zone continued to
move downslope, with another episode of “retrograde
motion” on October 26 at 12:00. (c) Final readings of
the INC500 until failure of the lower modules after Octo-
ber 31 at 12:00. For each plot, the set of readings in gray
represents the last reading from the previous plot (for (a),
this is the last reading shown in Figure 3). The sequence
of readings is given the same color scheme, with red
indicating “retrograde motion”.
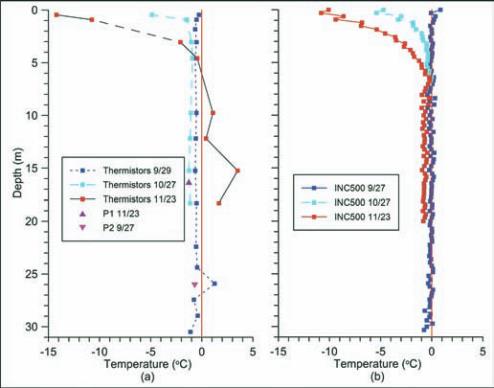
Figure 5. Temperature readings from the boring through
FDL-A. (a) Temperature readings from the thermistor
string and two VW piezometers attached to the outside of
the casing; “P1” and “P2” are readings from the vibrat-
ing wire piezometers installed at 16.3 and 26.1 m bgs,
respectively. (b) Temperature readings from the INC500.
Nearest pairs of readings were averaged to reduce the
scatter. For both plots, the phase-change temperature is
indicated by the vertical red line.