52
Geotechnical News December 2011
GEO-INTEREST
While I was grappling with these
experimental difficulties it dawned
on me that what I was really trying to
measure was nothing other than what is
elsewhere known as the Seepage Force.
And this Seepage Force [S
f
] could
much more easily be determined in a
standard laboratory permeameter. In
the permeameter the problem of hous-
ing effects, and the all but insurmount-
able difficulties in testing smaller sizes,
would not exist. I should now explain
what is meant by S
F
.
Seepage Force
Many years ago I came across the term
Seepage Force in Donald W. Taylor’s
1948 MIT textbook “
Fundamentals of
Soil Mechanics”
. He showed that S
F
per unit volume of saturated soil was
the product of hydraulic gradient “
i
“
and unit weight of water “
γ
w
”, that is,
S
F
/ unit volume =
i
γ
w
You can derive this formulation di-
rectly from consideration of the water
forces and specimen geometry of a per-
meameter as follows:
Let the cross-sectional area of the
soil specimen be “A” and it’s length
in the direction of water flow be “lgt”.
If “H
U
” is the upstream (driving) head
and “H
D
” is the downstream (resisting)
head, then the net water force (by defi-
nition, S
F
) causing flow is ΔF, where
ΔF = A (H
U
– H
D
)
γ
w
. Since the hydrau-
lic gradient across the specimen is
i
=
(H
U
– H
D
) ÷ lgt, and the soil volume
is A . lgt, we find Taylor’s equation as
shown above.
In practice, I have found the S
F
way
of sizing-up the effect of water passing
through soils quite useful. For those
who may not be altogether familiar
with the Seepage Force concept I’m
going to take a slight detour which I
think, apart from demonstrating that S
F
is a real and significant phenomenon,
should be of interest in its own right.
This involves some testing my com-
pany conducted at the NRC hydraulic
laboratories in Ottawa some time ago.
Model Testing at NRC Ottawa
During the 1980s hydrocarbon
exploration in the Canadian offshore
Arctic used artificial islands built
from locally dredged sand as drilling
platforms. This involved pumping
pipe-line dredge discharge into the
shallow waters of the McKenzie Delta.
This method of construction commonly
resulted in side slopes as flat as 3° to
5° which ruled out their use in deeper
waters because the enormous volumes
of sand required to do this could not be
placed within the time frame offered in
the ice-free windows.
If steeper side slopes could be built,
then the oil fields in deeper water
would then be accessible. It seemed
obvious to me that these flat slopes
were the result of outward seepage
flowing from the face of the accumulat-
ing sandfills. As I saw it, such destabi-
lizing flows could be brought about by
high pore pressures existing within the
body of the growing islands as a result
of the energy introduced into the soil-
structure by the impinging slurry jet,
as well as ongoing contractive distor-
tions within the loose sand pile itself.
So, if outward seepage was causing flat
slopes, would inward seepage result in
steeper slopes? Pumping water out of
the sandfill while the dredge placement
was progressing was maybe worth a
try, – at least in the lab.
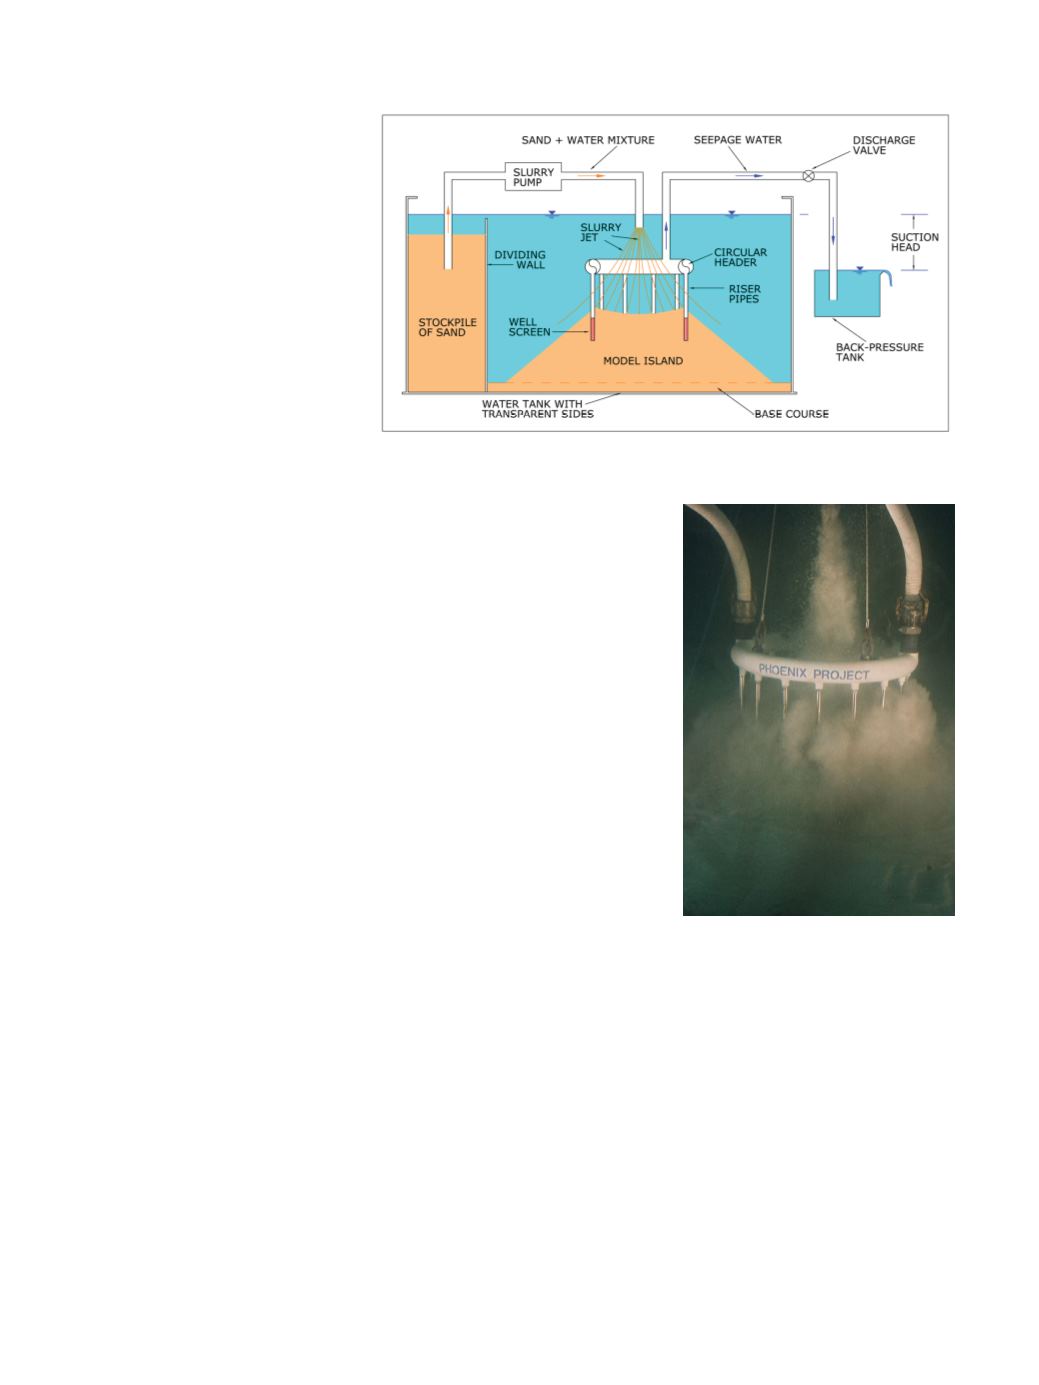
Figure 13 is a schematic of the mod-
el we used in a series of tests done to
see if the idea had any chance of work-
ing. Essentially, what is being checked
here is whether Seepage Forces are real
and potent, and whether they can be
advantageously invoked by circulating
water (in the right direction) through
the underwater sand pile. The test setup
employs a siphon to draw water from
the inside of a sand pile at the same
time as a sand slurry is building it up.
Figure 14a is a photograph taken
through the transparent front of the wa-
ter tank showing the sand-water slurry
jetting down through the water onto the
space between the ring of well screens.
Here it can be seen that the slurry has
some features in common with lique-
faction: individual sand grains, hav-
ing little, if any, solid contact with one
another; surrounded by water; and, all
moving energetically.
Figure 13. Schematic of NRC Ottawa model.
Figure 14a. Underwater sand slurry
jet.


