22
Geotechnical News • June 2012
GEOTECHNICAL INSTRUMENTATION NEWS
eter (with sand-pack). In these cases,
information about the permeability of
the soil and grout is available.
Table 1 summarizes the collected
data. The tips of the vibrating wire
piezometers (VW) included in Table 1
are within the same soil stratum as the
sand pack of the nearby open stand-
pipe piezometers (SP). While their
elevation is not exactly the same they
are close enough such that a similar
total head can be expected at both
instruments.
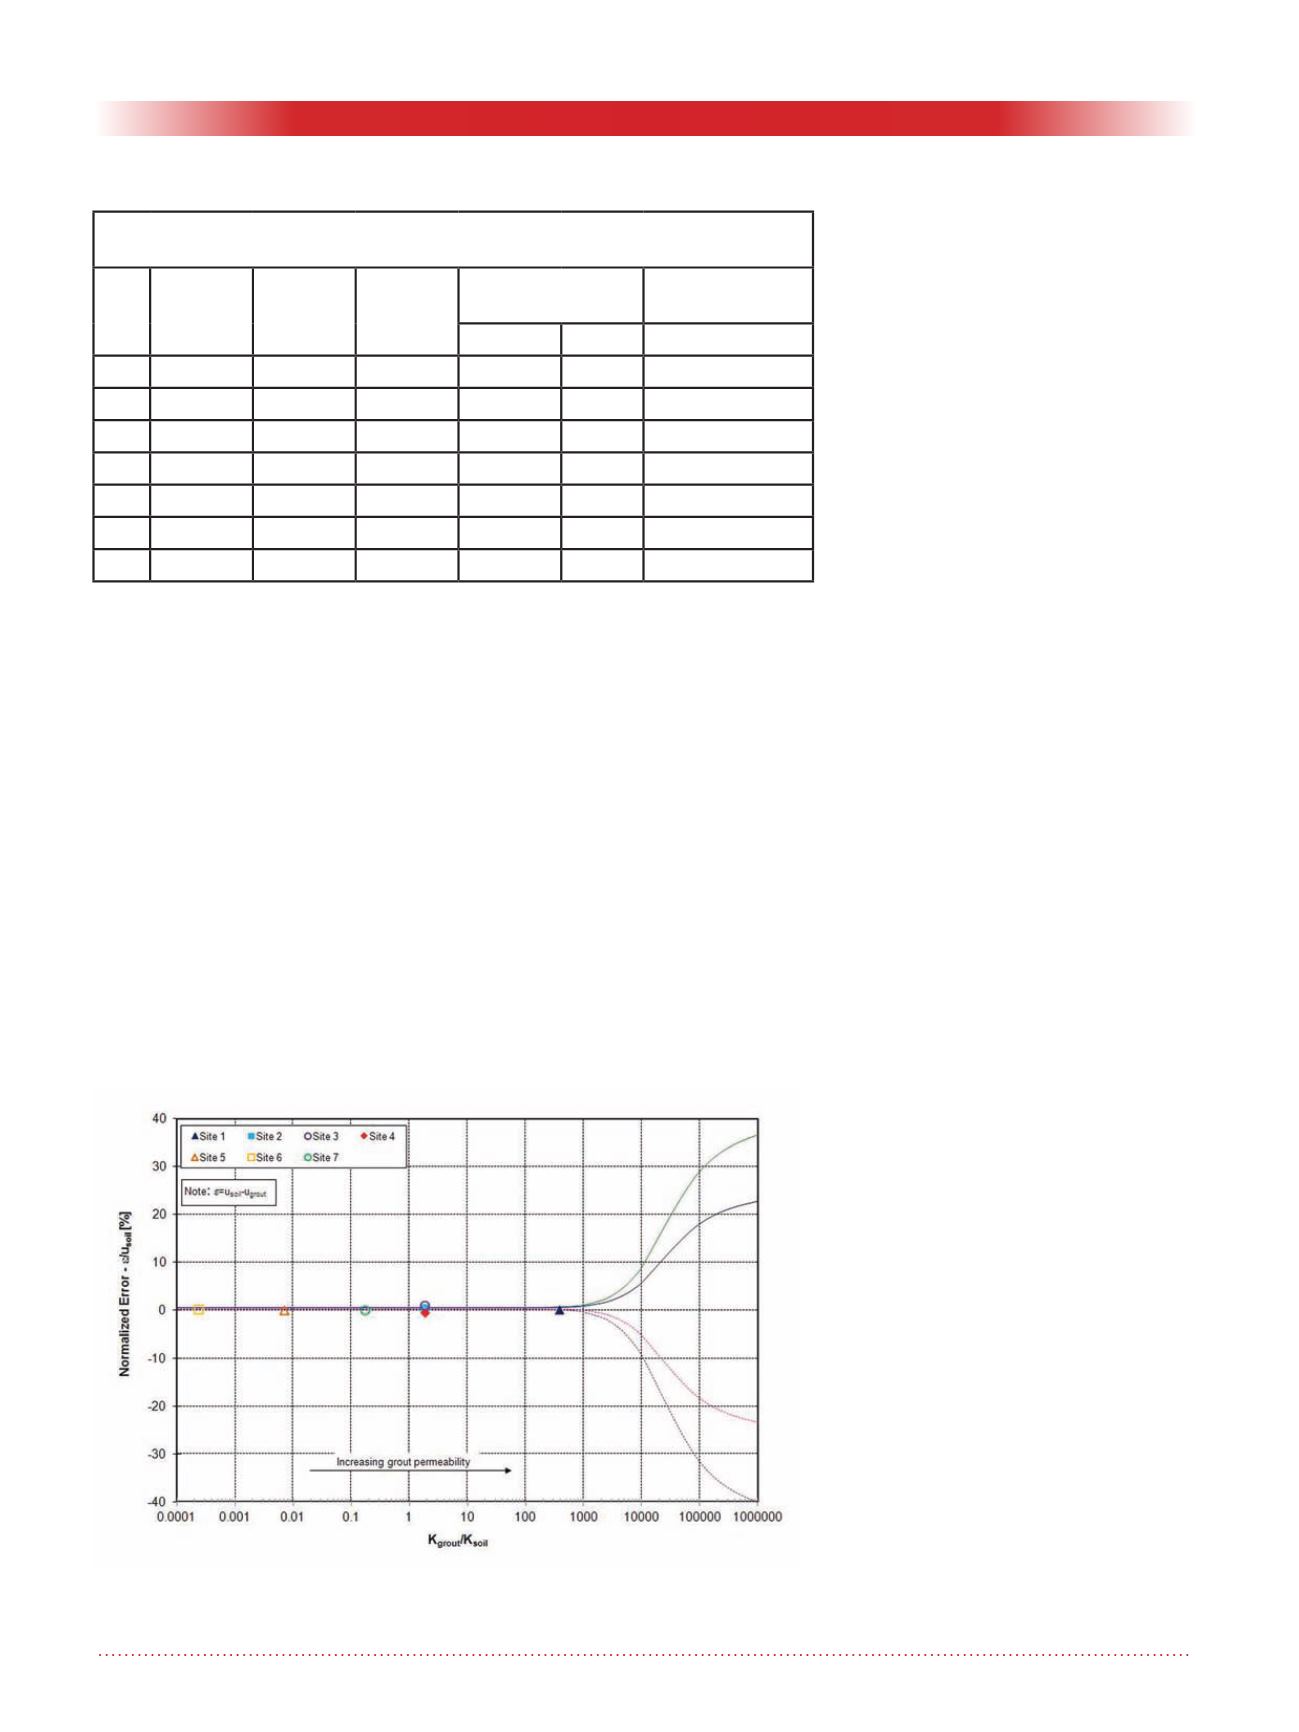
The data in Table 1 were used to
develop Figure 3, together with the
results of computer modeling that
were presented by Contreras et al.
(2008). The colored lines in Figure
3 are the summary of the computer
model results in terms of the error in
the pore water pressure measured as
a function of the permeability ratio.
The symbols in Figure 3 are the data
associated with the actual permeabil-
ity ratios and normalized errors from
Table 1. In developing Table 1, it was
assumed that the total head measured
in the open standpipe piezometers was
the actual total head. It can be seen
from Figure 3 that the measured and
predicted normalized errors are in
excellent agreement.
Installation in soft ground
During construction of embankments
over soft ground, monitoring typi-
cally includes measurement of pore
water pressures to track the consolida-
tion process as the excess pore water
pressure dissipation and settlement
take place. Because the fully-grouted
method allows for installation in a
nested configuration, it becomes very
attractive in this application. However,
two concerns have arisen, which might
compromise the correct performance
of the installations. First, the use of
a sacrificial grout pipe might result
in false data because of downdrag on
the grout pipe as vertical compression
proceeds. Second, will the column of
grout compress consistently with the
soft ground?
We have used the nested configuration
in several applications on soft ground
without any performance problems.
The following presents an example of
a nested fully-grouted installation in
soft ground.
The project consisted of construction
of a tailings dam on top of approxi-
mately 20 m of soft fine tailings/slimes
that were hydraulically deposited. The
fine tailings/slimes have a permeabil-
ity of 2.5x10
-6
cm/s. Three piezome-
ters were installed per borehole within
the fine tailings/slimes to monitor
the pore water pressure during fill
placement, and settlement plates were
installed to monitor settlement. Due
to the soft nature of the fine tailings/
slimes, the initial material placement
(i.e. working foundation) took place
during the winter months when a 1.2
m thick layer of frozen tailings forms
at the ground surface, allowing equip-
ment operation over the soft deposit.
After spring thaw and in the middle of
the summer, construction continued
by adding additional embankment
material.
Figure 4 shows the pore water pres-
sure and settlement data. Settlement
monitoring started when construc-
tion started. The piezometers were
installed 160 days after settlement in
Table 1: Comparison of total head from fully-grouted
and open standpipe installation
Site k (grout)
(cm/s)
k (soil)
(cm/s)
Kgrout /
Ksoil
Total Head
Measured
Normalized
Error (%)
VW (m) SP (m)
1 4.30E-06 1.12E-08 393.93 262.44 262.58
0.05
2 4.70E-06 2.50E-06 1.88
474.31 475.63
0.28
3 4.70E-06 2.50E-06 1.88
471.33 474.12
0.59
4 4.70E-06 2.50E-06 1.88
469.59 469.98
0.08
5 4.40E-06 6.24E-04 0.01
462.82 462.87
0.01
6 1.10E-06 4.58E-03 0.00
488.95 489.09
0.03
7 4.30E-06 2.50E-05 0.17
449.83 449.80
-0.01
Figure 3. Comparison of normalized errors (field and computer model)
with permeability ratio k
grout
/k
soil.


