34
Geotechnical News • June 2012
THE GROUT LINE
resolve claims, and for future
reference on large projects that
will likely be subject to further
grouting).
The authors believe that the listed
applications of the data have the status
of “Principles” that we all agree apply
to grouting works. And these Princi-
ples have improved grouting – taking
rock fracture grouting as an example,
adding electronic monitoring systems
enables the industry to routinely grout
to a ~ 0.5 Lugeon standard today
versus something like ~ 2 Lugeons
thirty years ago, while using no more
than Type 3 cement, and at ~ 30% less
cost. So why the ruckus? We suggest
the cause is that while all grouting
engineers might agree on the above
three principles, there is no common
or accepted methodology to set about
meeting these principles, and further,
there exists a notion that being “pro-
prietary” provides both risk aversion
and competitive advantage. None of
the above, however, provides best per-
formance for the owner. And none of
the above is in the long term interest
of our industry.
Background to computer
monitoring
A reasonable starting point is to ask:
what are the standards/procedures in
the industry for monitoring of grout-
ing using computer-based digital data
acquisition? For the answer to this
question, let us accept that the four
New Orleans specialty conferences
indicate the state of the industry.
Using fractured rock as an example,
these conference proceedings show
that although electronic monitoring
started thirty years ago (e.g. Ref. 2)
there is still no consensus on what
needs to be measured or how those
measurements should be plotted/dis-
played. These differences stem from
different underlying idealizations
and so forth on how grout behaves.
The “GIN-sufficient” group (work-
ing from Ref. 3 as updated in Ref. 4)
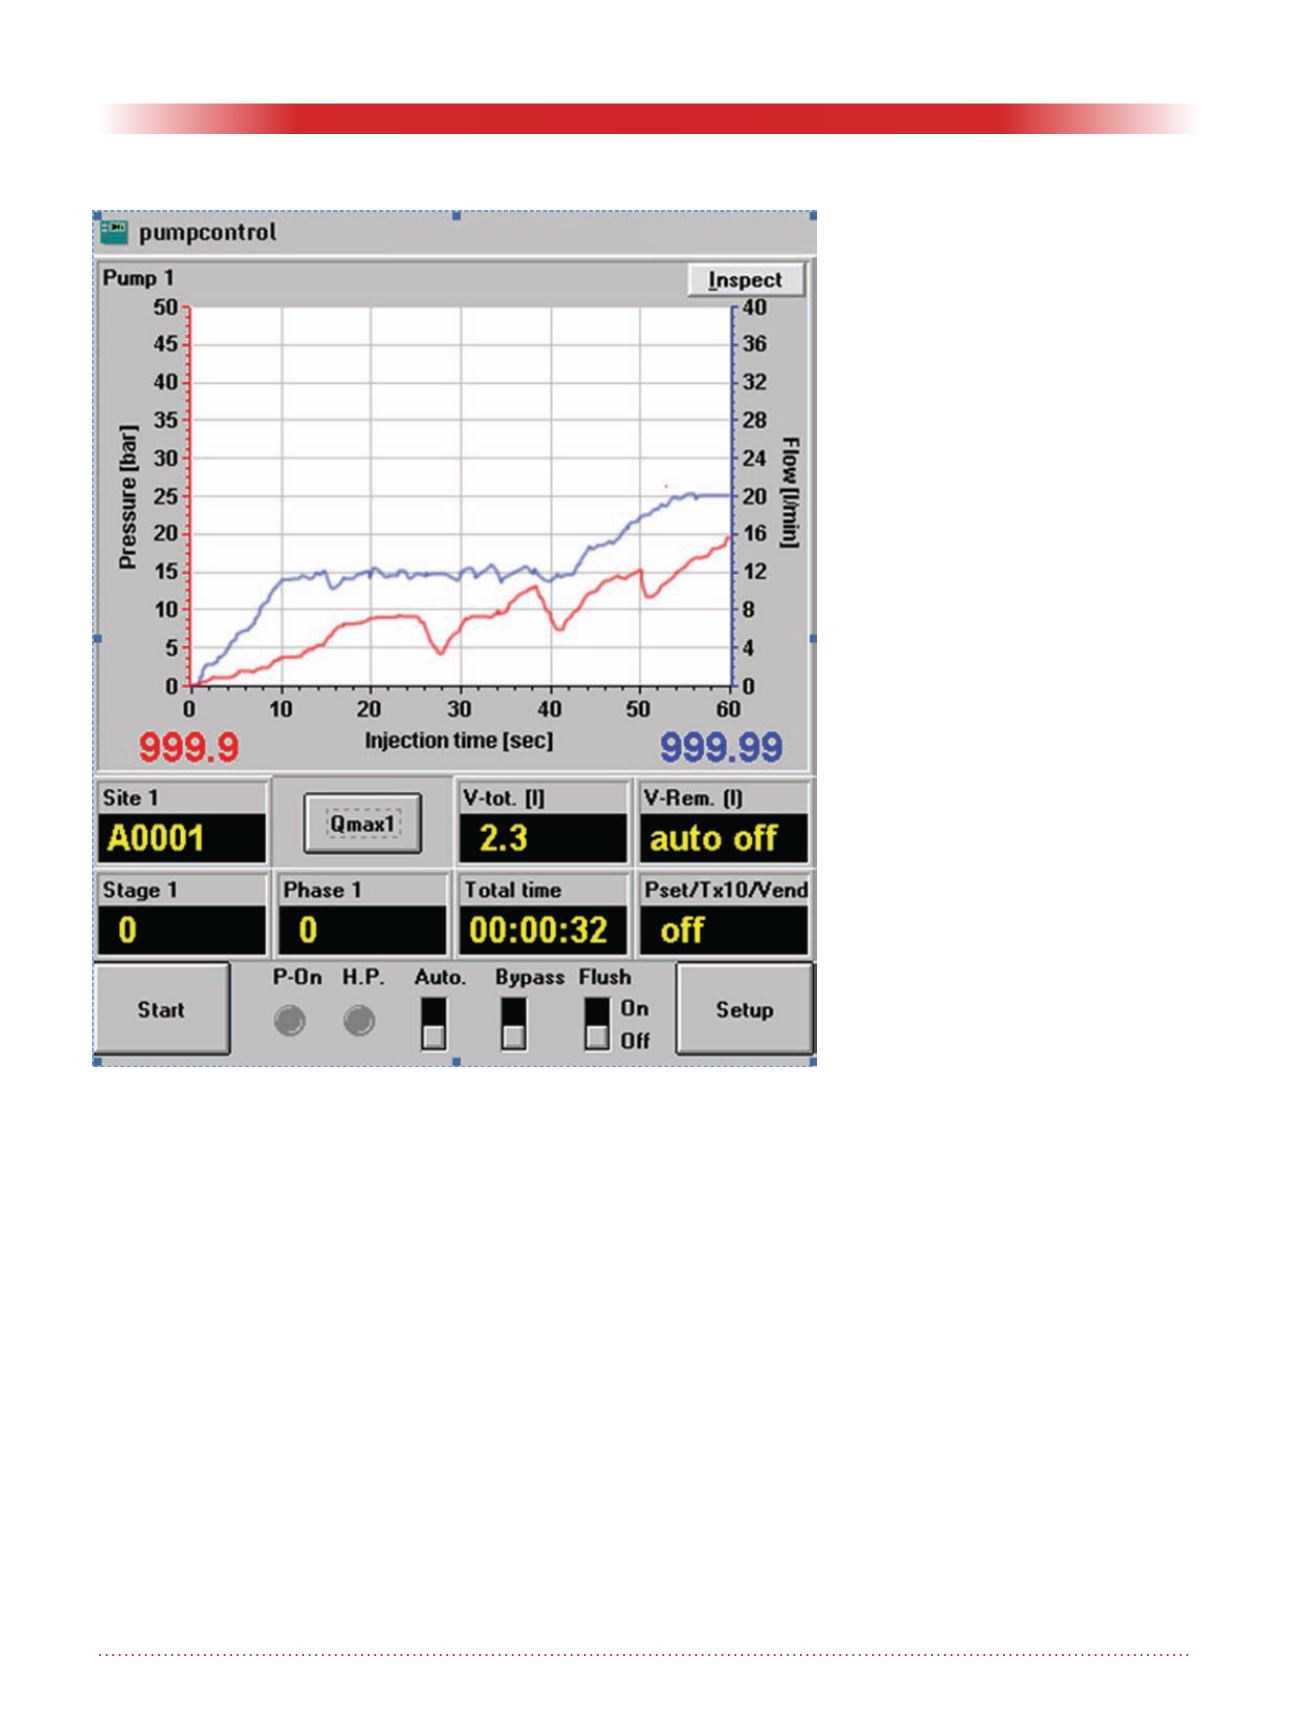
are likely happy with a single plot of
pressure versus volume injected. The
“GIN-misleading” group (e.g. Ref. 5,
6) require pressure versus flow rate,
penetrability versus time, and pen-
etrability versus volume injected. Yet
others (following Ref. 7) might ask
for ‘Grout Lugeon’ plotted against
time. What we should all ask for,
but remains absent, is to add real-
time measurement of grout rheology
(although a good start at this was
discussed at the Conference, Ref. 8).
Perhaps surprisingly, the issues and
computer systems for monitoring
of compaction grouting are similar
to those of fractured rock grout-
ing. Largely driven by one extreme
application (Bennett Dam; Refs. 9,
10), it is now accepted that compac-
tion grouting should be monitored for
injection pressure, grout flow rate, and
total grout injected (Ref. 11).
Sorting out unusual
occurrences
The evolution of monitoring, from
the perspective of these New Orleans
conferences, shows good apprecia-
tion of the role of computers around
Principle 1. But the issues surround-
ing applying monitoring data to sort
out unusual ground response or grout
behavior – Principle 2 - has seemingly
not been discussed (or at least, we did
not find a single paper in our readings
of that literature). Here we offer some
examples where the ability to retrieve
data after grouting for further evalua-
tion has been important (if not crucial)
Grouting Sample.


