Basic HTML Version


50
Geotechnical News • March 2014
www.geotechnicalnews.com
THE GROUT LINE
For tunnels with high inflows and very
strict demands (< 2 l/min), say urban
tunnels a tight grouting fan (high seal-
ing factor) together with thick sealed
zone is required (see Figure 4 above).
Achieving both these requirements are
though resource demanding.
Summarizing the above; water ingress
to a tunnel can be reduced by either
penetrating grout deep into the rock
mass, hence using a large grouting
pressure to produce a thick sealed
zone or by applying lower grout pres-
sure but with a tight grouting fan (high
sealing factor). One can say that the
ingress by only elaborating round the
thickness of the sealed zone is limited
but for some tunnels adequate enough.
From this point of view it looks like
the Norwegian style is to produce a
large thick zone and the Swedish way
is to get a high sealing factor and that
the Swedish approach is much more
based on theoretical background than
the Norwegian which is a typical
empirical approach with high confident
in using experience based grouting.
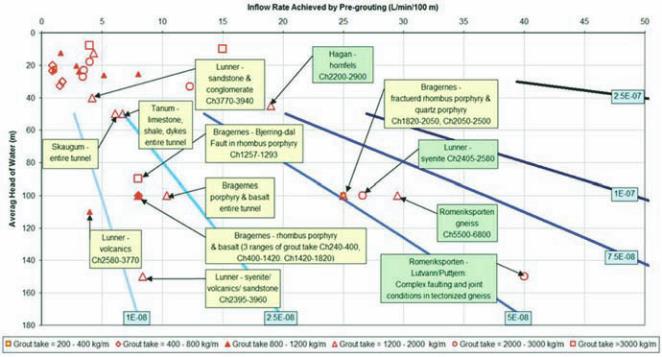
In recent years, tunnel inflow rates
as low as 2 L/min/100 m have been
specified and achieved in Norway
(Grøv, 2008b) and (Tattersall et al,
2009). Data for land-based tunnels
have been summarized in Figure
5 below. It shows the groundwater
inflow rates achieved by pre-grouting
and the average grout takes plotted
against the average head of water for
different tunnel segments. Correlation
lines which show trends in theoretical
inflow rates for uniform un-grouted
rock masses with different hydraulic
conductivities are shown on the plots
for comparative purposes. These have
been calculated from an equation for
deep, un-grouted tunnels given in
(Dalmalm, 2004) for a typical 10 m
diameter tunnel (79 m2 cross-sectional
face area). For example, a uniform
rock mass with a hydraulic conductiv-
ity of 5 x 10⁻⁸ m/s could be expected
to yield an average groundwater
inflow of about 25 L/min/100 m at
100 m depth. However, it should be
noted that the hydraulic conductivity
in the grouted zone needs to be much
less than the surrounding rock mass
in order to give an apparent overall
effective conductivity of 5 x 10⁻⁸ m/s
if the surrounding rock mass has a
much higher hydraulic conductivity.
For example, the data points for the
Bragernes tunnel between Ch1820 and
Ch2500 shown in Figure 2 imply that
the natural hydraulic conductivity of
the rock mass is much higher than 5 x
10-8 m/s and that the hydraulic con-
ductivity achieved in the grouted zone
must be much lower. The grout take of
1911 kg/m length of tunnel shown in
Table 1 for Ch2050-2500 confirms that
relatively intensive grouting efforts
were necessary to reduce the inflow
rate in this section of the tunnel.
The groundwater inflow limit targets
for land-based tunnels are shown in
chapter 3.1 above, whilst for sub-
sea tunnels in Norway, the typical
groundwater inflow rate target is 30 L/
min/100 m. Figure 5 is a collection of
different cases being gathered where
experience data has been provided.
The calculated rock mass permeability
is shown with diagonal lines, whilst
achieved inflow rate is plotted against
water head and consequential grout
take is shown with various symbols
(see key underneath the figure). Cases
where the measured groundwater
inflow rate exceeded the inflow rate
target are highlighted in green. For
both land-based tunnels and sub-sea
tunnels there are no data where the
inflow rate specified or achieved is
greater than 50 L/min/100 m (the
upper limit of the graphical plots
shown in Figure 5). For land-based
tunnels, about 50% of the inflow rates
achieved are less than 15 L/min/100 m
and in all cases but one the inflow
rates are less than 30 L/min/100 m. It
can be concluded based on Figure 5
that the grout take is difficult to assess
based on even factual parameters
as water head and inflow rate. The
historical case of Romeriksporten is
well known (Beitnes, 2002) and does
not provide an example of what is now
normally achieved. The case provided
much incentive for the development of
the better grouting strategies that now
form Norwegian state-of-practice.
In the case of sub-sea tunnels, there
are some examples where the overall
inflow rates exceeded 30 L/min/100 m,
but these tunnels were completed
between 26 and 13 years ago when
grouting practice was much less devel-
oped and groundwater inflow rates
may not have been as strictly enforced
as they are today. The more modern
sub-sea tunnels all show inflow rates
equal to or less than 30 L/min/100
m. Even in the basaltic rocks of the
Nordic region which are commonly
highly permeable, (Grøv & Nilsen,
Figure 5. Norwegian Examples of Inflow Rate Achieved and Grout Take for
Pre-grouted Land-based Tunnels.