26
Geotechnical News • September 2017
GEOTECHNICAL INSTRUMENTATION NEWS
#3) while one rover receiver (#4) was
installed outside the sliding zone. The
base station receiver (#1) was installed
at about 80 m away from the head
scarp which was assumed to be rela-
tively stable (as shown in Fig. 4). The
gateway was installed near the base
receiver. The entire system was pow-
ered by solar panels. Fig. 5 shows one
of GNSS receivers installed on site.
Learned from the monitoring
data
During the pilot project, this GNSS
monitoring system had continuously
been collecting data for nearly a
month, delivering the post-processed
results every minute. Although the
test duration is not very long and the
active landslide season had passed, the
results show very promising repeat-
ability (precision) as well as capture
small anticipated ground movement.
Fig. 6 shows the time-series graphs
of the relative ground movements of
receiver #2 and #4 in horizontal E/W
(East is positive in Y-axis) and verti-
cal directions (upwards is positive in
Y-axis). The following observations
can be drawn from Fig. 6:
• The precision in both horizontal
and vertical directions of the two
receivers are in millimeter-scale
while the horizontal precision is
better than vertical precision.
• Receiver # 2 which is inside the
slide zone shows almost zero
movement in E/W direction and
3 mm vertical movement down-
wards while receiver # 4 which
is outside the slide zone shows
about 5mm movement towards
the west (upslope direction) and
about 10 mm movement upwards
(all relative to the base station).
From the relative moving direc-
tion shown in receiver #4, it seems
plausible that the base station is
still located within the influence
zone of the landslide, and it moves
in the opposite direction as to what
receiver #4 shows. If this is the
case and we assume receiver #4
to be the stable point instead, the
actual movements of receiver # 2
would become approximately 12
mm downwards and 5 mm towards
the downslope direction (west).
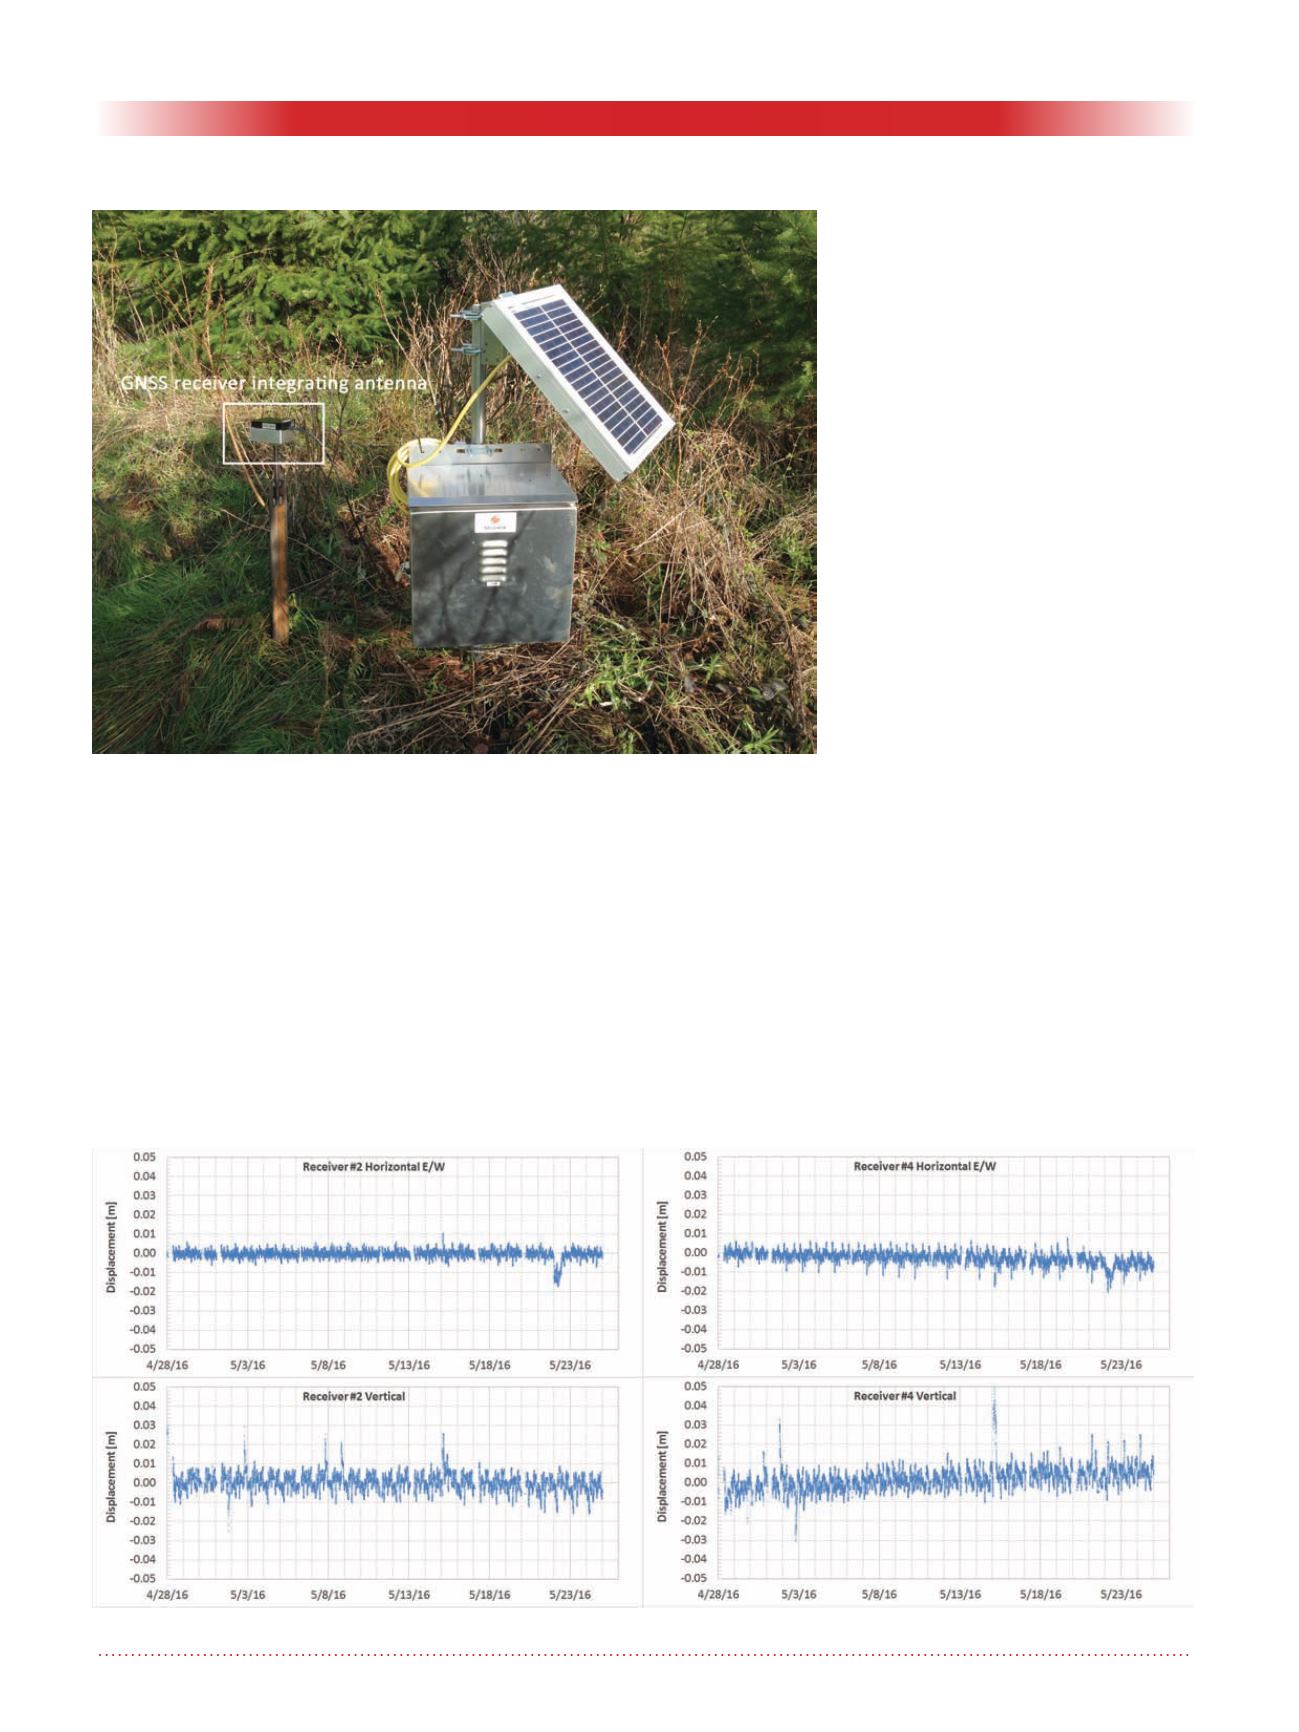
Figure 5. GNSS receiver and its power supply.
Figure 6. GNSS monitoring data.


