Geotechnical News • September 2017
37
GROUNDWATER
Sainte-Marthe was used. The mixing
was conducted within a barrel which
had an effective capacity of around
150 liters. The ingredients were
measured in the field with a portable
balance. The water was first poured
into the barrel. Then, the cement was
slowly added to the water and mixed
thoroughly. Next, bentonite powder
was gradually added into the barrel to
avoid forming clumps.
Grout samples were poured in
cylindrical plastic moulds after grout
mixing. The grout samples were left
in the field to set for a week, and then
transferred to a humid room for further
curing. During setting, grout G3 was
not stable and experienced significant
segregation. This segregation was also
observed in borehole F3, where grout
G3 was used for piezometer sealing.
The volume of grout G3 decreased by
25-30 % in both the mould and bore-
hole F3 after the setting period. The
low grout viscosity was most probably
responsible for the segregation.
The 28-day permeability and com-
pressibility tests were conducted on
the hardened 4-inch grout specimens
following standards ASTM D5084 and
ASTM D4767 (Table 1). The average
hydraulic conductivity values of grout
G1 and G3 were respectively 6.1×10
-9
and 1.2×10
-6
m/s (Table 1). Because
the clay hydraulic conductivity is
1.08×10
-9
m/s, the permeability ratios
are around 1100 and 6 for grouts G3
and G1 respectively and the surround-
ing clay.
Pore pressure response of fully
grouted VWPs
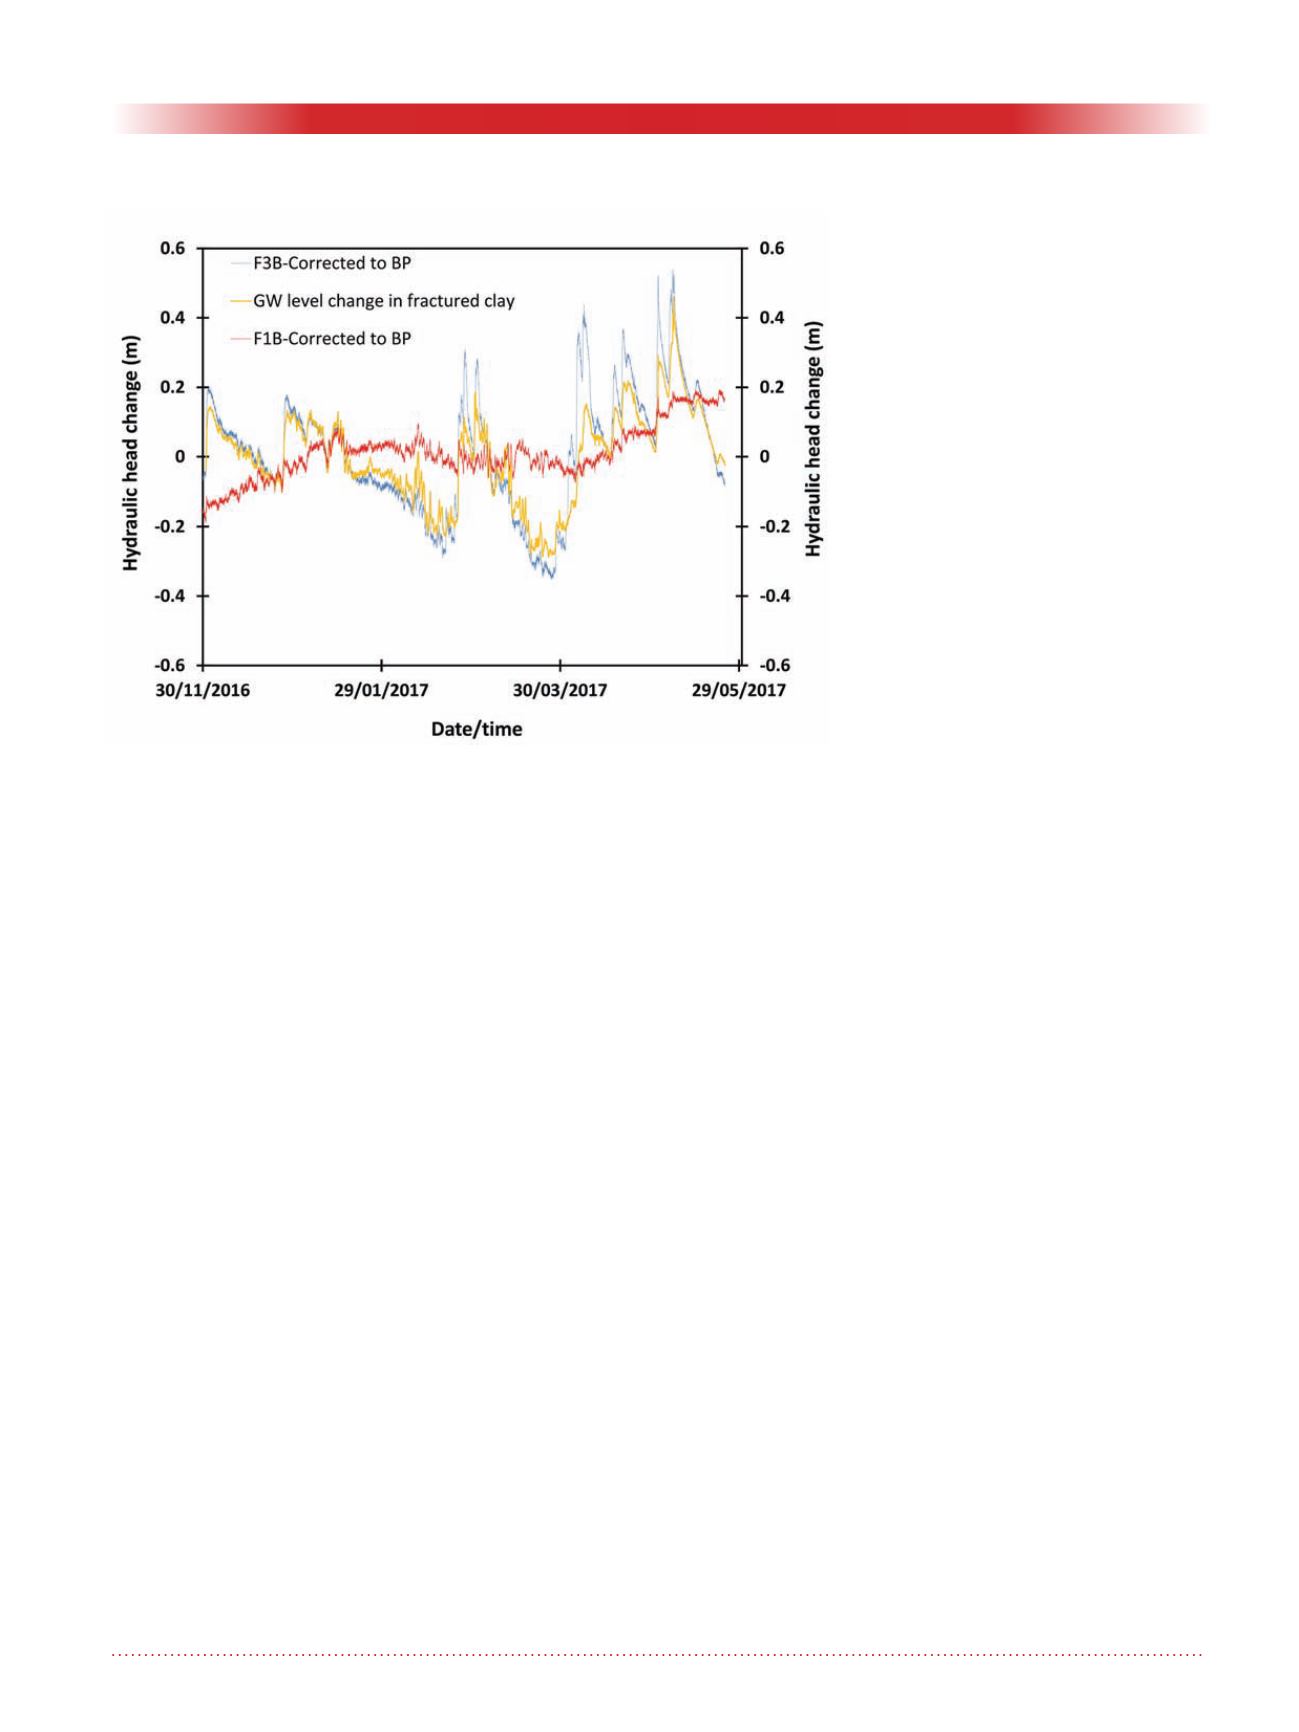
Figure 3 presents the change in
groundwater level in the fractured
clay and hydraulic head in the lower
portion of the intact clay. All data
were plotted around their respective
mean values observed during the
study period (November 2016 - June
2017). The observed pore pressure
and groundwater level data were cor-
rected for barometric pressure (BP)
effects using the multiple regression
technique as described in Marefat et
al. (2015). As shown in Fig. 3, the
groundwater level in the fractured
clay responded to several precipitation
and snow melting events. Secondly,
in the lower portion of the clay layer,
the pore pressure response of fully
grouted piezometers F1B and F3B
differed significantly. The response
of F3B, backfilled with high perme-
ability grout (K=1.2×10
-6
m/s, a
permeability ratio of 1100), mimics
the groundwater level change in the
upper fractured clay, which is acting
as an aquifer. This is a consequence
of the hydraulic connection between
the fully grouted piezometer and the
upper aquifer due to the relatively high
hydraulic conductivity of grout G3.
On the other hand, piezometer F1B
backfilled with the low permeability
grout (K=6.1×10
-9
m/s, a permeability
ratio of 6) registered a smooth pore
pressure response as expected for an
intact clay layer.
Discussion
The viscosity of the grout mix and
hydraulic conductivity of the hardened
grout are very important parameters
to register representative pore pres-
sure with fully-grouted piezometers.
There is no agreement on the accept-
able permeability contrast between the
soil and the grout. Furthermore, the
current method to check the proper
grout viscosity is qualitative. Our field
observations have shown that using
a grout with a hydraulic conductivity
ratio of less than 10 resulted in pore
pressure response that was smooth
and dampened as expected for intact
clay. However, a grout with a perme-
ability ratio of around 1100 resulted in
a totally differed response. A hydraulic
conductivity ratio of 1100 created
a hydraulic connection between the
fully grouted piezometer in clay and
the upper aquifer. As mentioned in
Mikkelsen (2002) the current recipe
for the installation of fully grouted
piezometers in soft soil is only an ini-
tial guide to prepare a suitable grout.
This study showed that following the
proposed recipes by Mikkelsen (2002)
without considering grout consistency
or viscosity can result in an unstable
grout. According to Mikkelsen (2002)
the grout mix should be like “thick
cream or pancake batter” to be physi-
cally stable and pumpable. However,
Figure 3. Groundwater level changes in the fractured clay and pore pressures
registered in the lower portion of borehole F3 (high-permeability grout) and
borehole F1 (low-permeability grout).


