Geotechnical News • September 2017
41
GEOHAZARDS
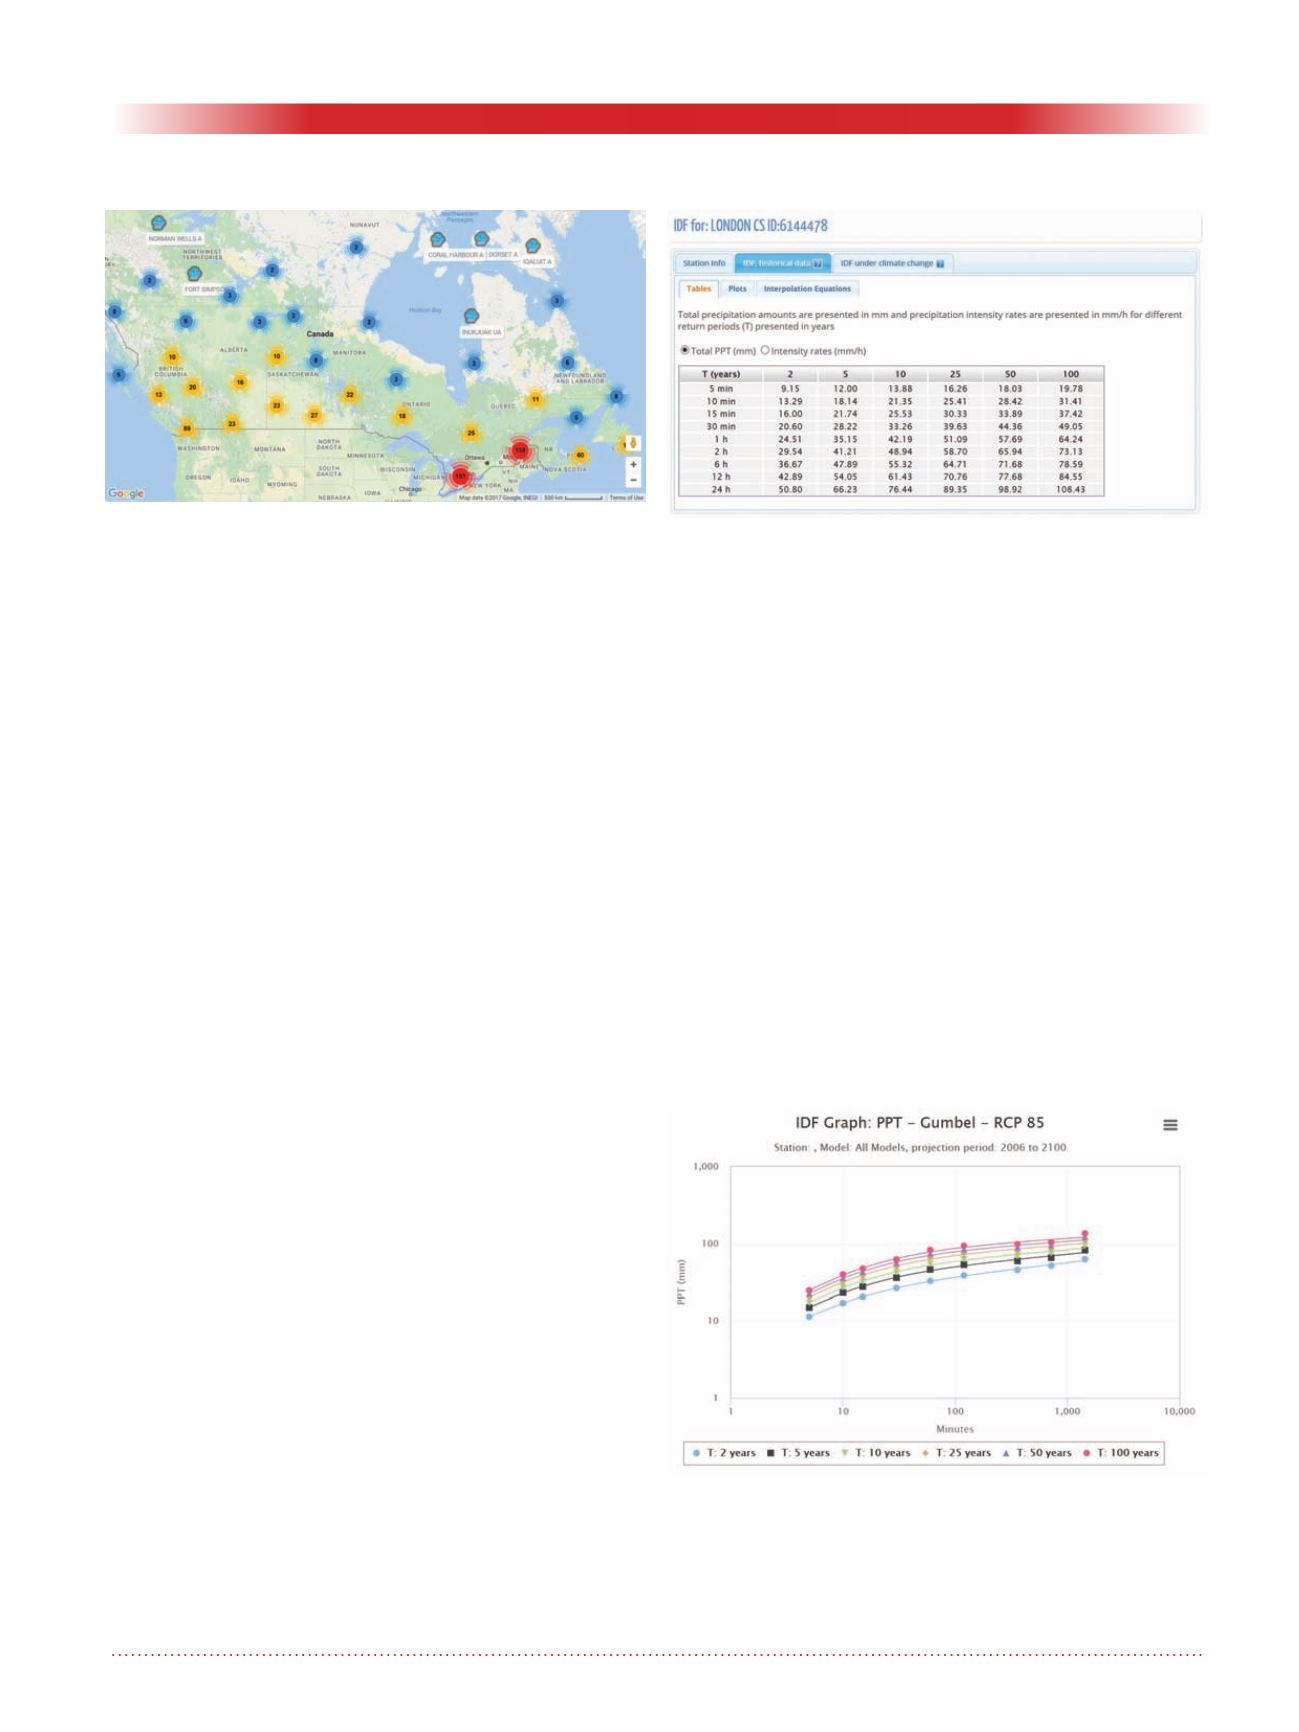
Figure 1: IDF_CC Tool GIS interface.
Figure 2: Sample of IDF_CC Tool output – IDF curves
based on the historical data. Users can display IDF
curves in tabular form, plots and equations. Version 2 of
the tool incorporates IDF curves fitted using Gumbel and
General Extreme Value (GEV) distributions.
Global climate models and
spatial downscaling
The IDF_CC Tool allows users to
apply data generated from one (or a
combination) of 9 GCMs downscaled
using two different methods to adjust
local IDF curves, based on the grid-
ded data provided by PCIC (2013).
The GCMs are designed to simulate
climate variables on a coarse spatial
scale – for example, 250 km by 250
km. To generate future conditions
using GCMs, the key input is green-
house gas emissions, but land-use,
energy production, global and regional
economies, and population growth
also affect future climate scenarios and
are incorporated into the GCMs. The
GCM output is spatially downscaled
to 10 km by 10 km grid using his-
torical daily gridded climate data for
Canada and two different downscal-
ing methods: Bias-Correction Spatial
Disaggregation (BCSD) and Bias
Correction/Constructed Analogues
with Quantile mapping reordering
(BCCAQ).
Temporal downscaling
The GCM data is provided on daily
time scale. That makes them insuf-
ficient for the development of IDF
curves. To make daily GCM results
usable for the update of IDF curves,
they must be downscaled both tempo-
rally. A statistical downscaling method
was applied to downscale GCM
results for the cre-
ation of new IDF
curves (Srivastav
et al, 2014).
Representative
concentration pathways
The international climate modeling
community has adopted four RCPs
through the Intergovernmental Panel
on Climate Change (see Figure 4).
These scenarios represent a range of
climate change impacts, from low
to high severity. These scenarios are
measured by radiative forcing (i.e.,
the net change in the radiation bal-
ance at the tropopause, or top of the
atmosphere — due to climate change
or other external drivers) and mea-
sured in watts per square metre, as
well as carbon
dioxide equiva-
lent concentra-
tion, a measure
of radiative
forcing poten-
tial caused by
a given type of
greenhouse gas
(as represented
by the equiva-
lent amount of
carbon dioxide).
The most severe
impacts are
predicted if no
climate policy
is adopted, while the lowest risks are
associated with stringent requirements
for climate policy that limit and reduce
greenhouse gas emissions.
Rain station information
The IDF_CC Tool stores data associ-
ated with 700 Environment Canada
operated rain stations from across
Canada. Roughly 500 of these stations
have 10 years of data – the minimum
time series used by Environment
Canada to develop IDF curves for a
specific location. Users can also cre-
ate and share their own rain station
information.
Figure 3: Sample IDF_CC Tool output – An IDF curve
updated using the ensemble option and RCP 8.5. Users
can compare historical IDF curves to curves that incor-
porate downscaled GCM outputs. Users can also click
different tabs to compare outputs for different RCPs and
rainfall return periods.


