Geotechnical News December 2010
51
WASTE GEOTECHNICS
known” because of missing data on
a certain parameter. The analyses fo-
cused on understanding tailings dam
failures with respect to time and space,
causes, and consequences. To compare
data within the two time groups, fail-
ure distributions for various parameters
were calculated using the following
formula:
Failure Distribution (%) = (Cases in a
parameter/Cases in a time group) × 100
Temporal and Spatial
Distributions
Figure 1 summarizes failure events over
time. Tailings dam failures remained
around 8 to 9 per decade in the 1940s
and 1950s but peaked to around 50
events/decade during the 1960s,
1970s and 1980s. The high failure
rate during these later decades may
be attributed to an increased mining
activity immediately after World War
II to address the high global demand
for metals, minerals, and raw materials.
This demand was related to post-war
reconstruction in North America and
Europe and to the initial development
of newly independent countries at the
end of colonialism in Asia and Africa.
With sufficient engineering experience,
implementation of tougher safety
criteria, and improved construction
technology, failures were significantly
reduced in the 1990s and remained at
about 20 events/decade in the 1990s
and 2000s.
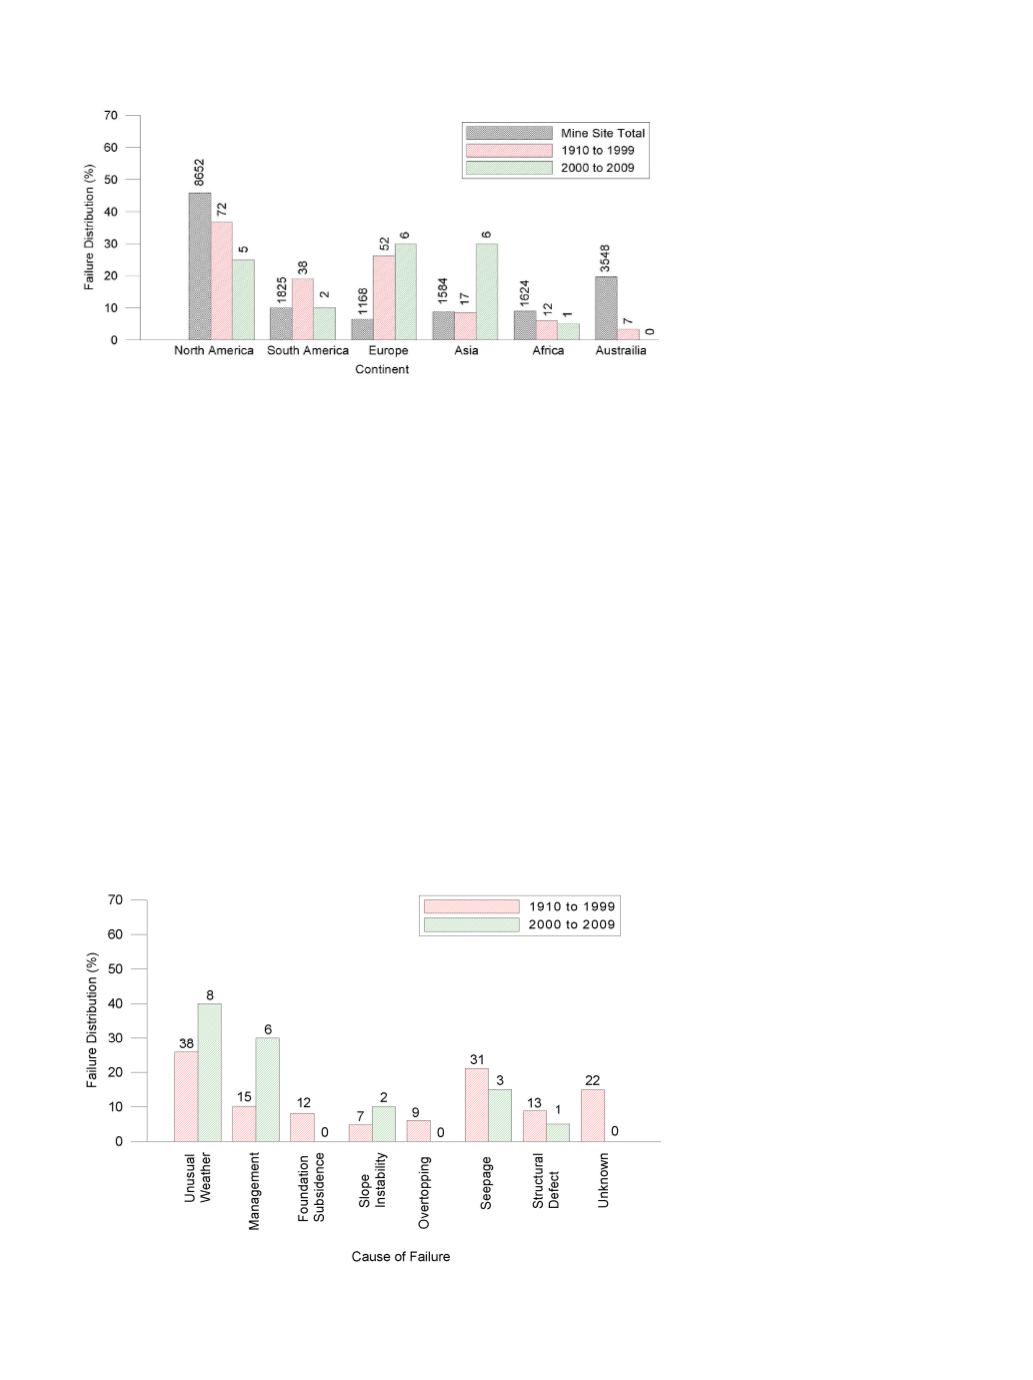
Figure 2 gives the regional failure
distribution in relation to mine site to-
tals. Of the 198 pre-2000 cases, most
failures occurred in North America
(36%), Europe (26%), and South
America (19%). Conversely, the 20
post-2000 cases primarily took place
in Europe and Asia with a combined
failure distribution of 60%. Despite the
high mining activity in North America,
South America, Africa, and Australia,
the decline in failure events in these re-
gions over the past decade is attributed
to an improved engineering practice.
Meanwhile, the Asian and European
mining operations have experienced
an increased failure rate because of a
booming Chinese economy requiring
vast metal and mineral resources and
a higher reporting from Eastern Eu-
rope after the demise of communism.
Clearly, tailings dam failure incidents
have shifted geographically from de-
veloped countries to developing coun-
tries. Therefore, it is crucial for these
countries to learn from the post-war
experience of the developed countries
to reduce tailings dam failures.
Causes of Failure
Figure 3 illustrates the distribution of
tailings dam failures by cause. This
figure differentiates the climatic and
managerial reasons of dam failure from
the mechanicisms of failure. Failures
due to unusual rain increased from 25%
pre-2000 to 40% post-2000. This might
be attributed to the recent changes
in climatic conditions, particularly
at mine sites close to the seas and/
or located in equatorial regions that
have received high precipitations. As
such conditions may increase in both
numbers and severity, dam design in
such areas must incorporate the effect
of climate change. Likewise, failures
due to poor management accounted for
10% and 30%, respectively, for the two
time groups. This increase indicates the
rush for natural resource exploitation
while compromising on engineering
standards in various parts of the globe.
According to Rico et al. (2007), poor
management includes inappropriate
dam construction procedures, improper
maintenance of drainage structures,
and inadequate long-term monitoring
programs. The climatic and managerial
reasons have a bearing on all of the
mechanisms of tailings dam failure.
Figure 3. Failure distribution by cause.
Figure 2. Failure distribution by region.


