58
Geotechnical News December 2010
GEO-INTEREST
My reasoning from there went like
this: Water pressure exerted on the base
of the cylinder, and felt by the scales,
was obviously a response to the weight
of the falling ball above. But why the
delay ? Why not the full weight right
away ? There had to be another force
involved temporarily, acting as a buf-
fer. I couldn’t think of anything to fit
the bill other than viscous drag. And
such a drag force is known to be gener-
ated between a solid and a fluid in rela-
tive motion. Fluid Mechanics had this
all wrapped up generations ago so, as
you’ll see, it was just a matter of go-
ing to their comprehensive literature to
work things out from there.
My scales was not sensitive enough,
nor did it respond fast enough, to let me
see what was happening between these
two values. For this I needed to find
a good laboratory in some university
which would listen to a maverick with
an odd notion about the genesis of pore
water pressure.
UBC Test Setup & Prediction
Fortunately for me my good friendYogi
Vaid is Professor Emeritus at UBC and
still had access to the fundamental
soils laboratory at UBC which gained
recognition as a world leader in
triaxial testing during his tenure. Yogi,
who was well used to listening to me
ramble on about my abiding prejudice
that pore water pressure had to come
from relative motion between the
phases, was happy to help. Here I got
not only the better scales and a better
readout device that I needed, but also
the assistance of Scott Jackson and his
experimental expertise.
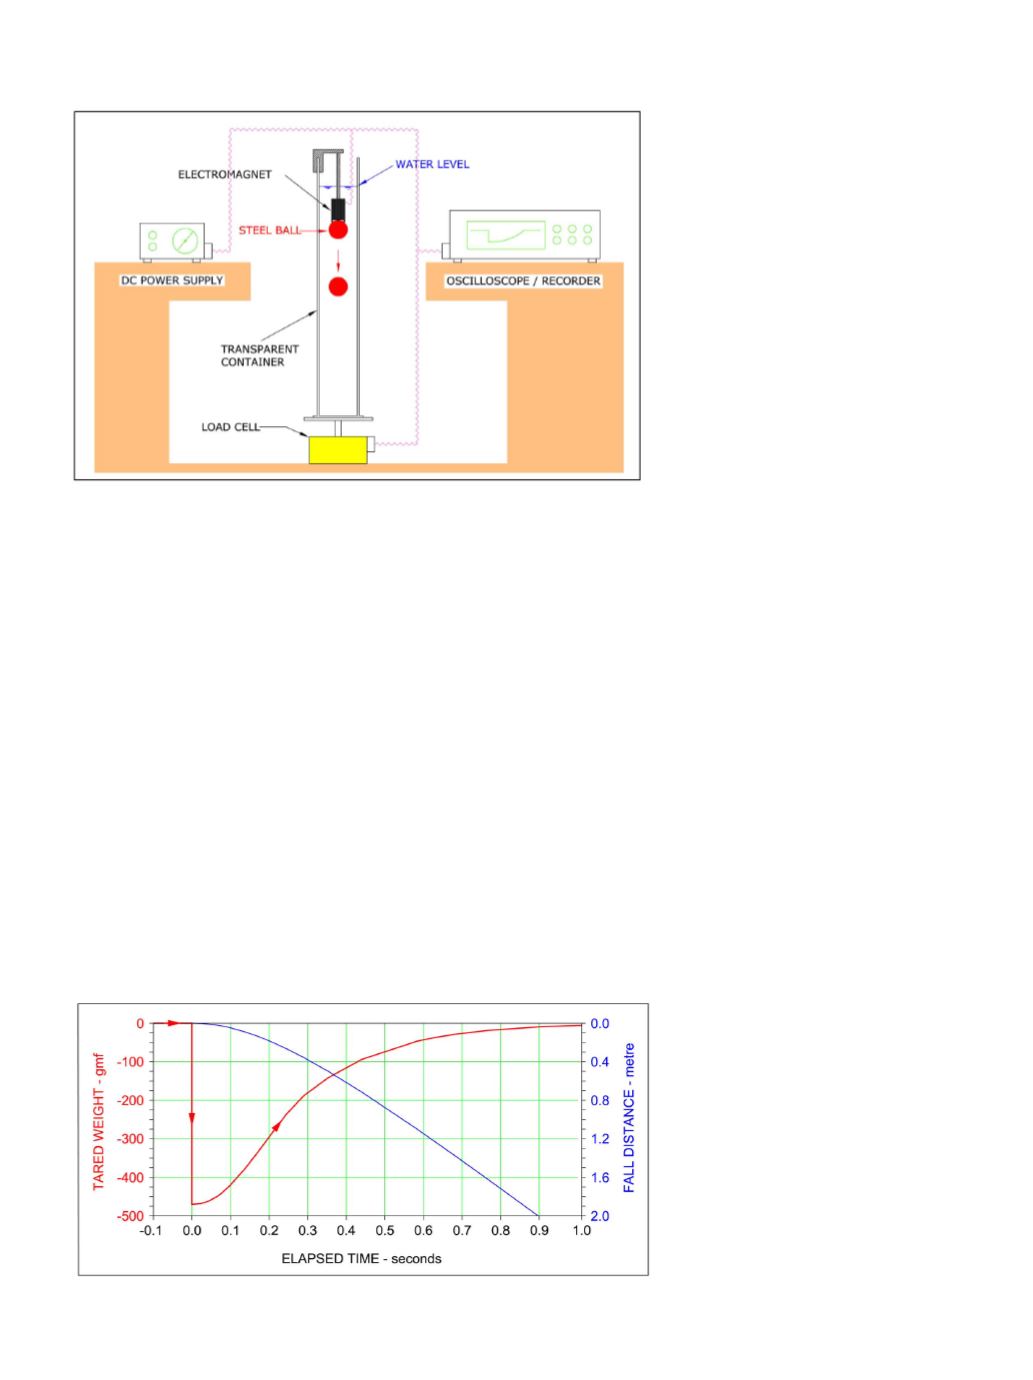
For this opportunity I designed the
apparatus shown in Figure 3. The de-
sign intent was to discover what was
going on during the intermediate period
between releasing the ball and the time
its weight showed up on the scales. I
decided the best thing to do was to
record only one thing – the weight
of the full system, that is, ball, water,
and apparatus hardware. This involved
some compromises. To get sensitivity
in the readout the weight of the water
had to be kept within reasonable limits
and this meant using a cylinder which
was a bit shorter and narrower than
I’d have liked. Also the ball had to be
quite heavy. I decided on a 2 inch ball
bearing, using steel rather than ceramic
because of its far greater buoyant mass
density. Steel had the added advantage
that it could be held in place by an elec-
tromagnet which could also drop it with
a flick of the switch. The whole system,
ball and all, sat on a load cell which was
connected to an oscilloscope and a data
recorder. All was necessary after things
were setup was to power up the record-
er and switch off the magnet.
In lab testing, as in site investigation
sampling and construction instrumen-
tation, you get much more out of it if
you have already thought enough about
what to expect to let you risk a predic-
tion. With this in mind I calculated the
weight history I anticipated on the ba-
sis of the hydrodynamics that I thought
were going on. This prediction is shown
on Figure 4. I wanted it to be a clear
understanding that if the prediction was
right then the hypothesis was justified,
and if the prediction was wrong then
it was time to forget the whole thing.
Needless to say I wouldn’t be writing
this if it turned out all wrong.
In the Next Article
In the next of this series I’ll give the
results of the UBC test and compare
them with the prediction made
beforehand. And there I will also lay
out the reasoning behind the predictive
method and explain how the required
calculations were made.
W.E.Hodge
Geotechnical Engineer
P.Eng., M.ASCE
P.O. Box 287, Lumby, BC, V0E 2G0
(778) 473 4505
Figure 4. Prediction of UBC test results.
Figure 3. UBC laboratory test setup.


