52
Geotechnical News December 2010
WASTE GEOTECHNICS
Geotechnical engineers have long
understood the importance of observ-
ing pore water pressures and embank-
ment deformations in tailings contain-
ment facilities. This is because these
data correlate well with several types
of failure and as such provide a basis
to rectify the situation throughout the
mine life and beyond (Peck, 1969).
We must learn to earn the confidence
of multi-disciplinary teams, which are
operative at mine sites, to ensure the
safety of tailings dams. Perhaps, we
have learnt that message with regards
to seismic liquefaction (that results in
swift and drastic events), where fail-
ures of this type have dropped from
14% in pre-2000 cases to zero in post-
2000 cases:the 2010 Chilean earth-
quake of magnitude 8.8 did not cause
any failure. Good earthquake designs
are partly because of our understand-
ing of dynamic loading such as blasting
that is common practice at mine sites.
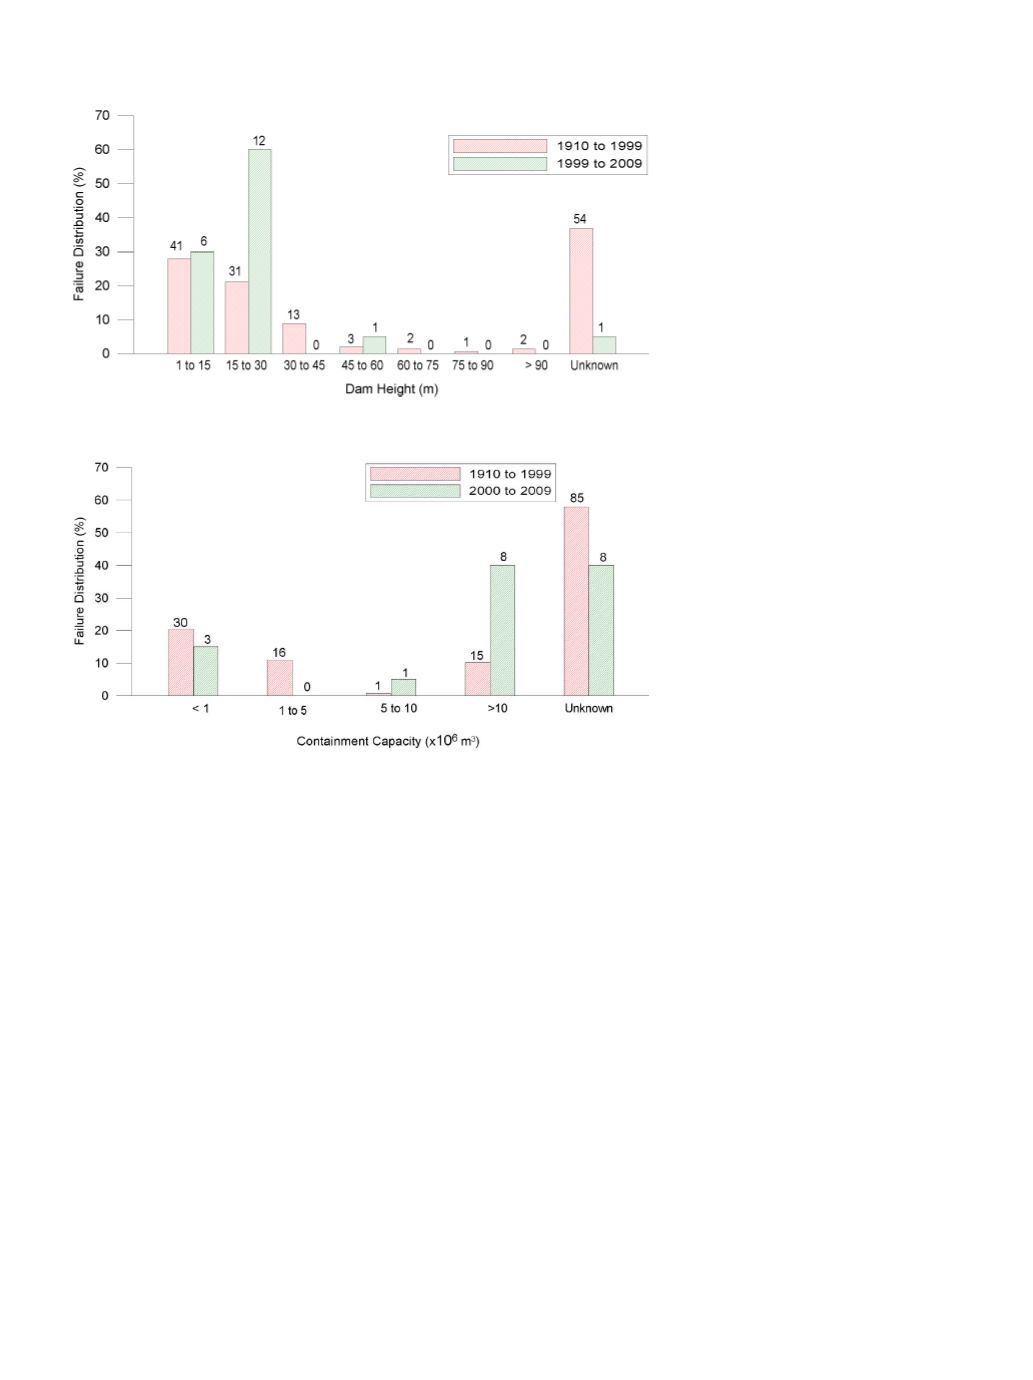
Figure 4 shows the distribution of
tailings dam failures by dam height.
Failures are found to mainly occur in
dams with heights of up to 30 m. A
plausible reason may be that unconsol-
idated materials with high pore water
pressures in such relatively low dams
(possibly in their early stages of devel-
opment) are yet to develop adequate
shear strength to counter the resisting
forces. This is especially the case when
the tailings dams are constructed using
the upstream method that is still a com-
mon practice in some of the developing
countries (Vick, 1999). Further, a com-
parison of the two time groups reveals
that failure in dams of up to 15 m height
increased from 28% to 30% whereas
failure in dams with heights between
15 m to 30 m increased from 21% to
60%. The recent increase in failure of
such dam heights may be attributed to
the combined effect of rapid dyke con-
struction along with poor monitoring.
This is particularly true for some of
the re-opened mines (due to increased
commodity prices in the 2000s) for
which the tailings containment facili-
ties were raised based on pre-closure
construction practice.
Figure 5 gives the distribution of
tailings dam failures by containment
capacity. This figure corroborates well
with data in the previous figure by
indicating that about 31% (pre-2000
events) of failures occur in small to
intermediate size facilities that contain
up to 5 x 10
6
m
3
of tailings. The drop
in such events to 15% in the post-2000
cases may be ascribed to containment
geometry requiring low dams. Similar-
ly, the increase in tailings dam failures
from 10% to 40% in large dams (stor-
ing in excess of 10 x 10
6
m
3
of tailings)
should be due to one or more of the
afore-mentioned reasons.
Impact of Failures
Figure 6 summarizes the failure
distribution by tailings release amount.
The figure illustrates that a significant
portion (29% for pre-2000 cases and
40% for post-2000 cases) of the dam
failures released up to 0.5 x 10
6
m
3
of tailings to the environment. This
correlates well with data depicted in
Figures 4 and 5 where a comparable
number of incidents fell in small to
intermediate size dams. The current
figure shows that usually about
one-fifth of the contained volume
is released. Even such volumes are
sufficient to cause extensive damage to
life, property, and health. For example,
0.5 x 10
6
m
3
of released tailings are
enough to drown about 1200 North
American style single-family homes.
Figure 7 illustrates the distribution
of tailings dam failure by socio-eco-
nomic impact.
Failures were assigned
to a certain parameter that best de-
scribed the actual incident. The main
impacts were found to be environ-
mental pollution, loss of life, and in-
frastructure damage. Parameters such
as environmental pollution and infra-
structure damage were found to respec-
tively decrease from 52% and 20% for
pre-2000 events to 35% and 15% for
post-2000 cases. This is in accordance
with the above findings that about one-
Figure 4. Failure distribution by dam height.
Figure 5. Failure distribution by containment capacity.


