34
Geotechnical News September 2011
GEO-INTEREST
seemed to be a logical inconsistency
between laboratory results and saying
that motion was the source of pore
pressure. The point he raised was: In
an undrained triaxial test, when there
is an increase in pore water pressure
recorded during a test, how could that
pressure increment still remain after
specimen straining was stopped, if
motion was the only reason for pressure
generation in the first place? I believe
this is a question which is likely to arise
again, so I feel the need to address it
now.
One response might be just to point
out that what’s going on inside the
membrane of an undrained test is di-
rectly analogous to stopping the pis-
ton’s advance in a hydraulic cylinder
which is not leaking. But I think it is
more useful to look at the triaxial ap-
paratus itself. The cell pressure is
transmitted across the membrane to
the soil particles and also to the water
inside the sealed specimen enclosure.
The force radially inwards at any stage
is equal to the membrane surface area
times the cell pressure. The outward
balancing reaction to this force is the
summation of the pressure increments
on each particle in contact with the
membrane, plus the pressure on the re-
maining area of membrane in contact
with the pore water. During the test,
while straining is being imposed, these
forces and pressures change depend-
ing on how the soil-structure dilates or
contracts. But the moment straining is
halted these values are “frozen”, and
apart from any subsequent creep of the
soil-structure which might occur within
the membrane, I can see no reason for
the pore pressure at the end of the test
to diminish in value. It just sits there.
Gonzalo Castro
Dr. Castro’s research work at Harvard
must surely rate amongst the best
and most significant geotechnical
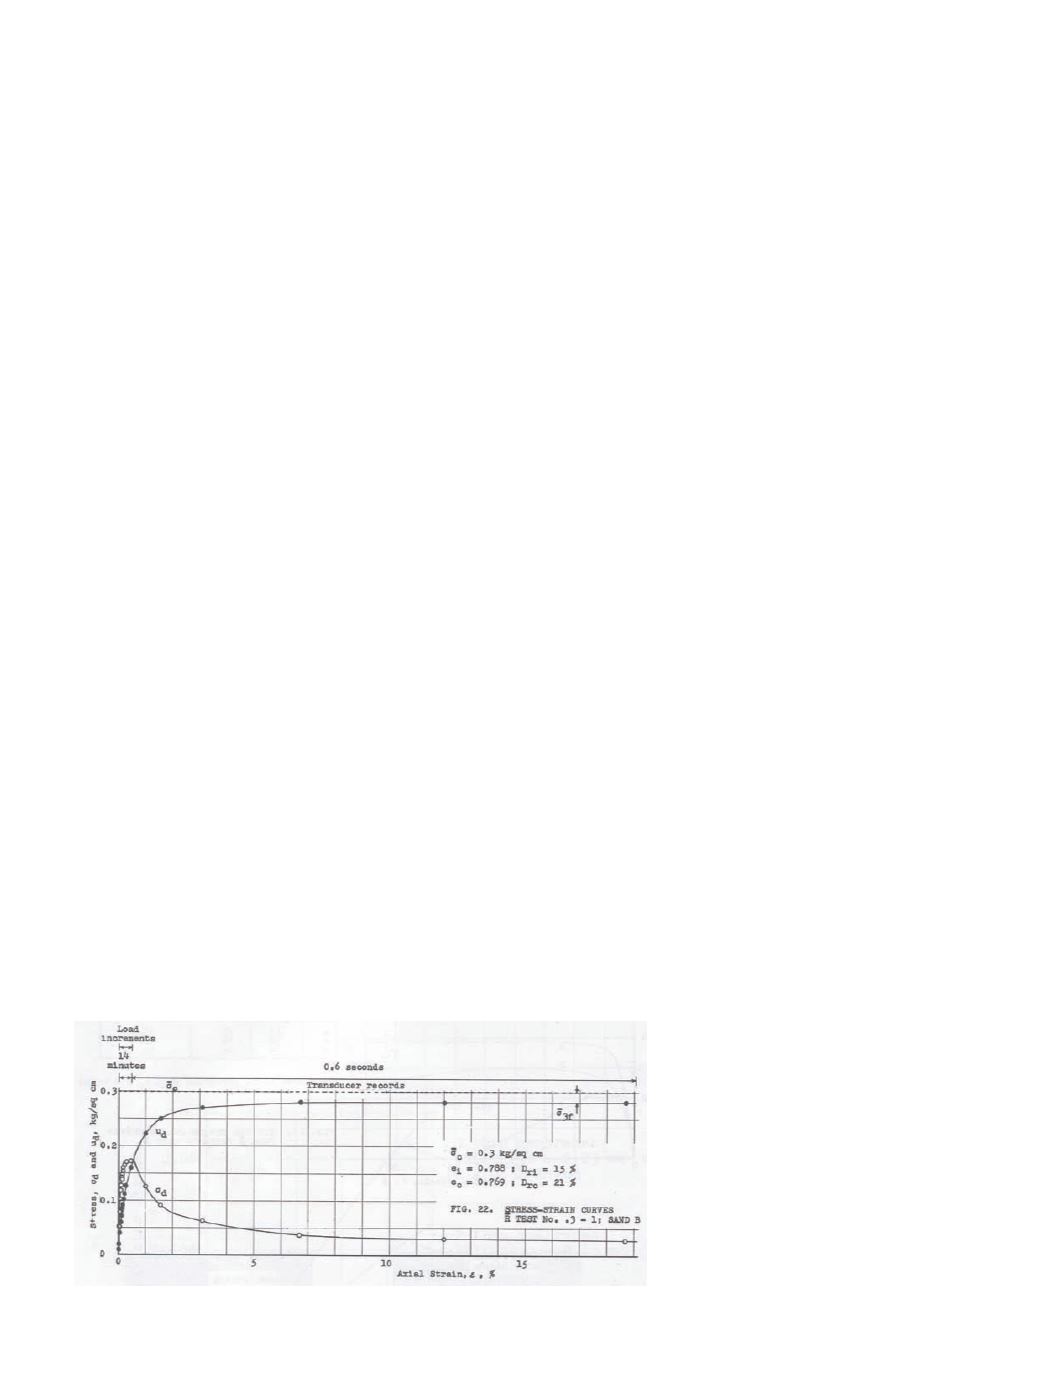
laboratory work yet performed. Figure
10 is a photocopy of his “Fig 22”
from his work published in 1969 as
Harvard Soil Mechanics Series No.
81.
It shows the stress-strain record
of a consolidated undrained triaxial
test performed on a specimen of his
sand type B. Liquefaction was brought
about by monotonic axial compression.
Here u
d
is the pore pressure change
induced by application of deviator
stress σ
d
. The axial load was increased
gradually over a 14 minute period by
adding dead load increments. When
the load exceeded the strength of the
soil-structure it failed in an instant.
One thing that I find particularly
informative here is that approaching
the point of failure the pore pressure
is only about half its final value; it is
only after failure of the soil-structure
that it rose to about 93% of confining
pressure. In fact I believe the pore
pressure increase prior to liquefaction
may be attributable to changes in the
proportions of the membrane interface
with particles and with water as the
soil-structure tries to accommodate the
increasing load. It is also apparent on
this data record that much of the pore
pressure increase happens while the
particles are collapsing.
Yoginder P. Vaid
The work done at the University of
British Columbia under Professor
Vaid’s guidance in the early 90s was
most useful and enlightening to me.
Consolidated undrained triaxial testing
of Fraser River sand showed quite
clearly that whereas this uniformly
graded natural material was dilative
in compression at even the loosest
(pluviated) densities, it could be
brought to liquefaction at relative
densities up to 40% when subjected to
axial extension. The importance of this
radically different behavioral response
to stress path will be discussed below
with respect to wave forms created
during earthquakes.
Triaxial Results in Terms of
Fall-to-Diameter Ratio
In Part 2 the Fall-to-Diameter ratio
[F/D] was introduced as a numerical
criterion for assessing the opportunity
of individual spheres to reach v
T
based
on their diameter, in comparison with
the amount of space available for them
to fall through water as their packing
arrangement changed from a loose
state to a dense state. In fact what I
used were the maximum and minimum
void ratios (e
max
and e
min
) of idealized
arrays of uniform spheres. There I
gave the value of F/D as 0.29, which
is the numerical value of the exact
mathematical solution, 1-1/√2, for this
change in position. Another way of
arriving at this same value is to consider
the ratio of downward displacement
of the centre of gravity of a saturated
mass of uniform spheres per unit height
of the initial assemblage. This can be
expressed as (e
max
– e
min
) / (1 + e
max
)
which is also equal to 1-1/√2, since e
max
= 6/π -1 and e
min
= 6/π√2 -1. Taking
advantage of this correspondence I
decided to plot the results of both
Castro and Vaid in terms of what
their specimen void ratios suggested
about this type of equivalence to F/D,
by replacing e
max
in this relationship
with the loose void ratio at which the
specimen was prepared.
Figure 11 is based on the same com-
putational approach used to make Fig-
ure 6 in Part 2 of this series. Here it has
been drawn to a larger scale since it is
only sand sizes I want to look at. The
heavy black line labeled 99% identifies
the ratio of the distance a spherical par-
ticle must fall in relation to its diameter
Figure 10. Castro’s Fig. 22 from his Harvard publication.


