30
Geotechnical News September 2011
WASTE GEOTECHNICS
cinder, and soils. The proportion of
each component varies from one region
to another. Even within a single region,
changes in living standard, legislation,
seasonal factors, and pre-treatment
and recycling activities may result
in changes in the waste stream over
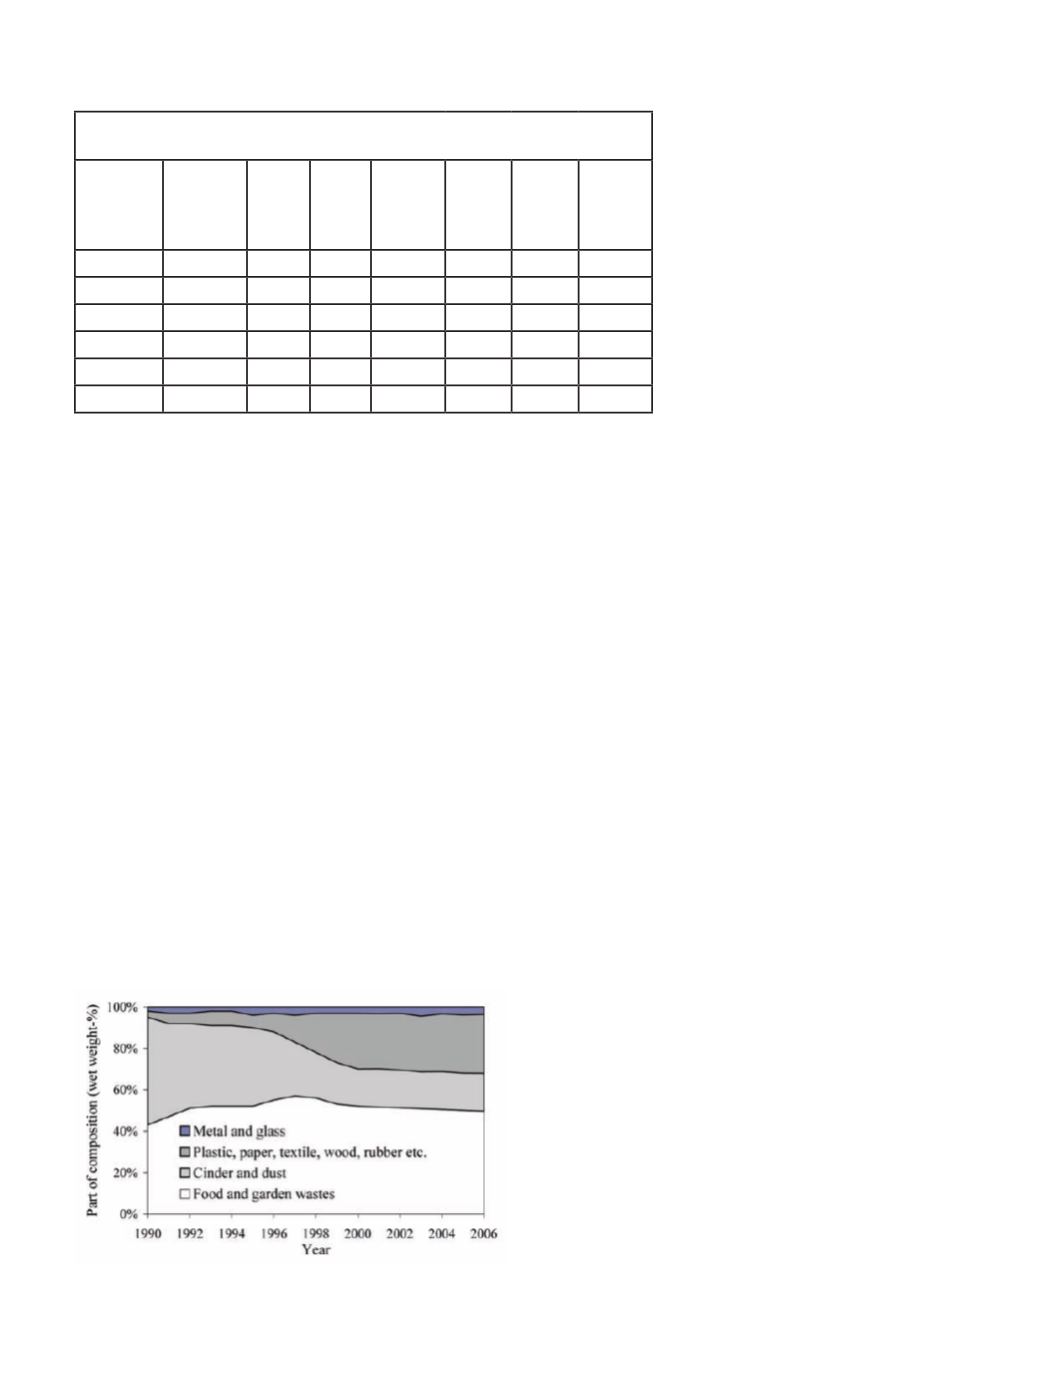
time. Figure 2 shows the changes in
the composition of the MSW collected
in Suzhou, China, between 1990 and
2006. The content of each component
was measured and calculated on a
wet-weight basis. It can be seen that
there has been a significant decrease
in the cinder content between 1990
and 2000. The change was the result
of an increased use of natural gas for
cooking. At the same time, there was
an increase in recyclable content and
food and vegetable wastes between
1996 and 2000. Since 2000, the change
in the composition of MSW has been
relatively small.
Table 1 shows a comparison of
waste composition among China, In-
dia, Korea, Singapore, UK, and USA
as of 2000. The MSW in China and
India contain much more putrescible
organic wastes (i.e., kitchen food and
vegetable wastes which account for
40-50%) than the MSW generated in
Korea, Singapore, UK, and USA. The
content of mineral materials (i.e., cin-
der, dust, concrete, etc.) in China and
India is also higher than that in UK and
USA. These differences are likely at-
tributable to the differences in cooking
styles and the living standard among
the countries. The MSW in UK and US
contains much more recyclable matters
(particularly paper products) than the
MSW found in China and India.
The characteristics of waste com-
position in China result in particu-
lar properties of the wastes. First, the
initial water content of the MSW col-
lected in China ranged from 40 to 60%
(by wet mass), which is much higher
than that of Europe and North America.
The high water content is mainly due
to the high con-
tent of food and
vegetable wastes
in China.
Second, the
high organic con-
tent in the Chi-
nese MSWmeans
that there is more
b i od eg r adab l e
material for de-
c o m p o s i t i o n
in the landfill.
Waste
decom-
position
tends
to result in greater loss of solid mass,
higher production of gas and leachate,
and greater time-dependent compres-
sion. The hydraulic and mechanical
properties of the wastes in China are
significantly different from the proper-
ties of the low organic content MSW
in Europe and North America. Labora-
tory measurements of MSW generated
in China indicate that 300-400 L of gas
(i.e., mainly methane and carbon diox-
ide) could potentially be produced per
kilogram of dry waste.The decomposi-
tion-induced compression of Chinese
MSW was measured as 25% of the
waste thickness when it was subject-
ed to a vertical load of 50 kPa. Shear
strength measurements on China’s
MSW showed a mobilized cohesion of
23 kPa and an internal angle of friction
of 10° for the fresh wastes. Wastes with
a fill age of 11 years showed a cohesion
of nearly zero and an angle of internal
friction of 28° (Chen and Zhan, 2007).
Third, the high water content in the
MSW in China tends to result in high-
er leachate production at a landfill, as
compared to the MSW from Europe
and North America. Field observations
at many landfills in southern China in-
dicate that the quantity of daily leach-
ate production is more than 30% of the
daily dumping mass of wastes. In addi-
tion, the high content of food and veg-
etable wastes in China tends to result in
a low pH value and high mass loading
in the leachate generated at the land-
fills (He, 2009). Field and laboratory
measurements indicate that the leachate
produced at landfills in China generally
possess a much higher mass loading
(Total Organic Carbon (TOC): 9,000-
13,000 mg/L; Chemical Oxygen De-
mand (COD): 40,000-80,000 mg/L) and
a lower pH value (4.8~5.4), compared to
North American landfills (TOC: <8,000
mg/L; COD: 15,000-35,000 mg/L).
Landfill Disposal of MSW
Simple Dump
Landfilling is the dominant disposal
method of MSW in China. The history
of landfilling in China is about 10
years behind countries in Europe and
North America. Prior to 1990, simple
dumping of MSW prevailed in most
cities of China with generally small
Table 1 Comparison of waste composition among China, India, Korea,
Singapore, UK, and USA generated in 2000 (Unit: %)
Country Food,
vegetable
Dust,
cinder
Paper Plastic,
textile,
wood,
rubber
Metal,
glass
Others Water
content
China
43.6
23.1 6.7 16.7 3.4
6.5
52
India
41.8
40.3 5.7 8.2
4
0
42
Korea
24.6
NA 25.8 NA 13.5 NA 39
Singapore 23.5
17.1 21.6 11.1
24
2.7
35
UK 20
12
34 21
15
0
32
USA 15.3
10.9 29.8 29.4 12.7 1.9
30
Figure 2. Change in the composition of MSW generated in
Suzhou, China.


