Geotechnical News • June 2013
31
GROUNDWATER
This eq. 2 was also derived from the
classical solution (Bear 1972). Thus, if
the
K
distribution is normal, then
n
e
HEHA
is equal to the single
n
e
of each
layer. This is commonly found with
laboratory column tests using homog-
enized soils. However, field tests yield
n
e
HEHA
values that may be much lower
than the
n
e
of each layer (Stephens
et al. 1998). This contradicts the
assumption of a normal
K
distribution.
Therefore, experimental data support
the assumed lognormal
K
distribution,
which is usually observed with small-
and middle-scale
K
values (Law 1944;
Freeze 1975; Chapuis 2013).
Experimental verification
Laboratory tests
Consider a 1D laboratory tracer
test. Homogenized sand was poured
between two parallel walls. The
sand was compacted as regularly as
possible, for example in small layers
about 2.5 cm high, using a free-falling
tamper of defined mass and height of
fall. At the end of the process, despite
all the precautions, the sand layers
yet have a small variation in
K
. The
distribution of
ln
K
and its variance are
estimated first, and then the resulting
n
e
is obtained with eq. (1).
The sand is defined by its grain size
distribution curve (GSDC) and the
roundness factor, RF, of its particles.
The minimum and maximum values
for
n
,
n
min
and
n
max
, or void ratio
e
,
e
min
and
e
max
, ca
n
be given by standard
tests (ASTM D4253, D4254) or with
the chart of Youd (1973). This chart
was transformed into equations linking
e
min
and
e
max
to the sand coefficient
of uniformity,
C
U
, and RF (Chapuis
2012a). Some variation in GSDC and
compaction yields some variation in
effective diameter
d
10
and void ratio
e
, which can be used to assess the
K
distribution. In the next example it is
assumed that
d
10
= 0.16 ± 0.2 mm, and
e
= 0.52 ± 0.06.
Many methods were proposed to
predict
K
. After assessing 45 methods,
Chapuis (2012b) found that the most
reliable for non-plastic soils are that of
Hazen (1892) when coupled with Tay-
lor (1948), Kozeny-Carman (Chapuis
and Aubertin 2003), and Chapuis
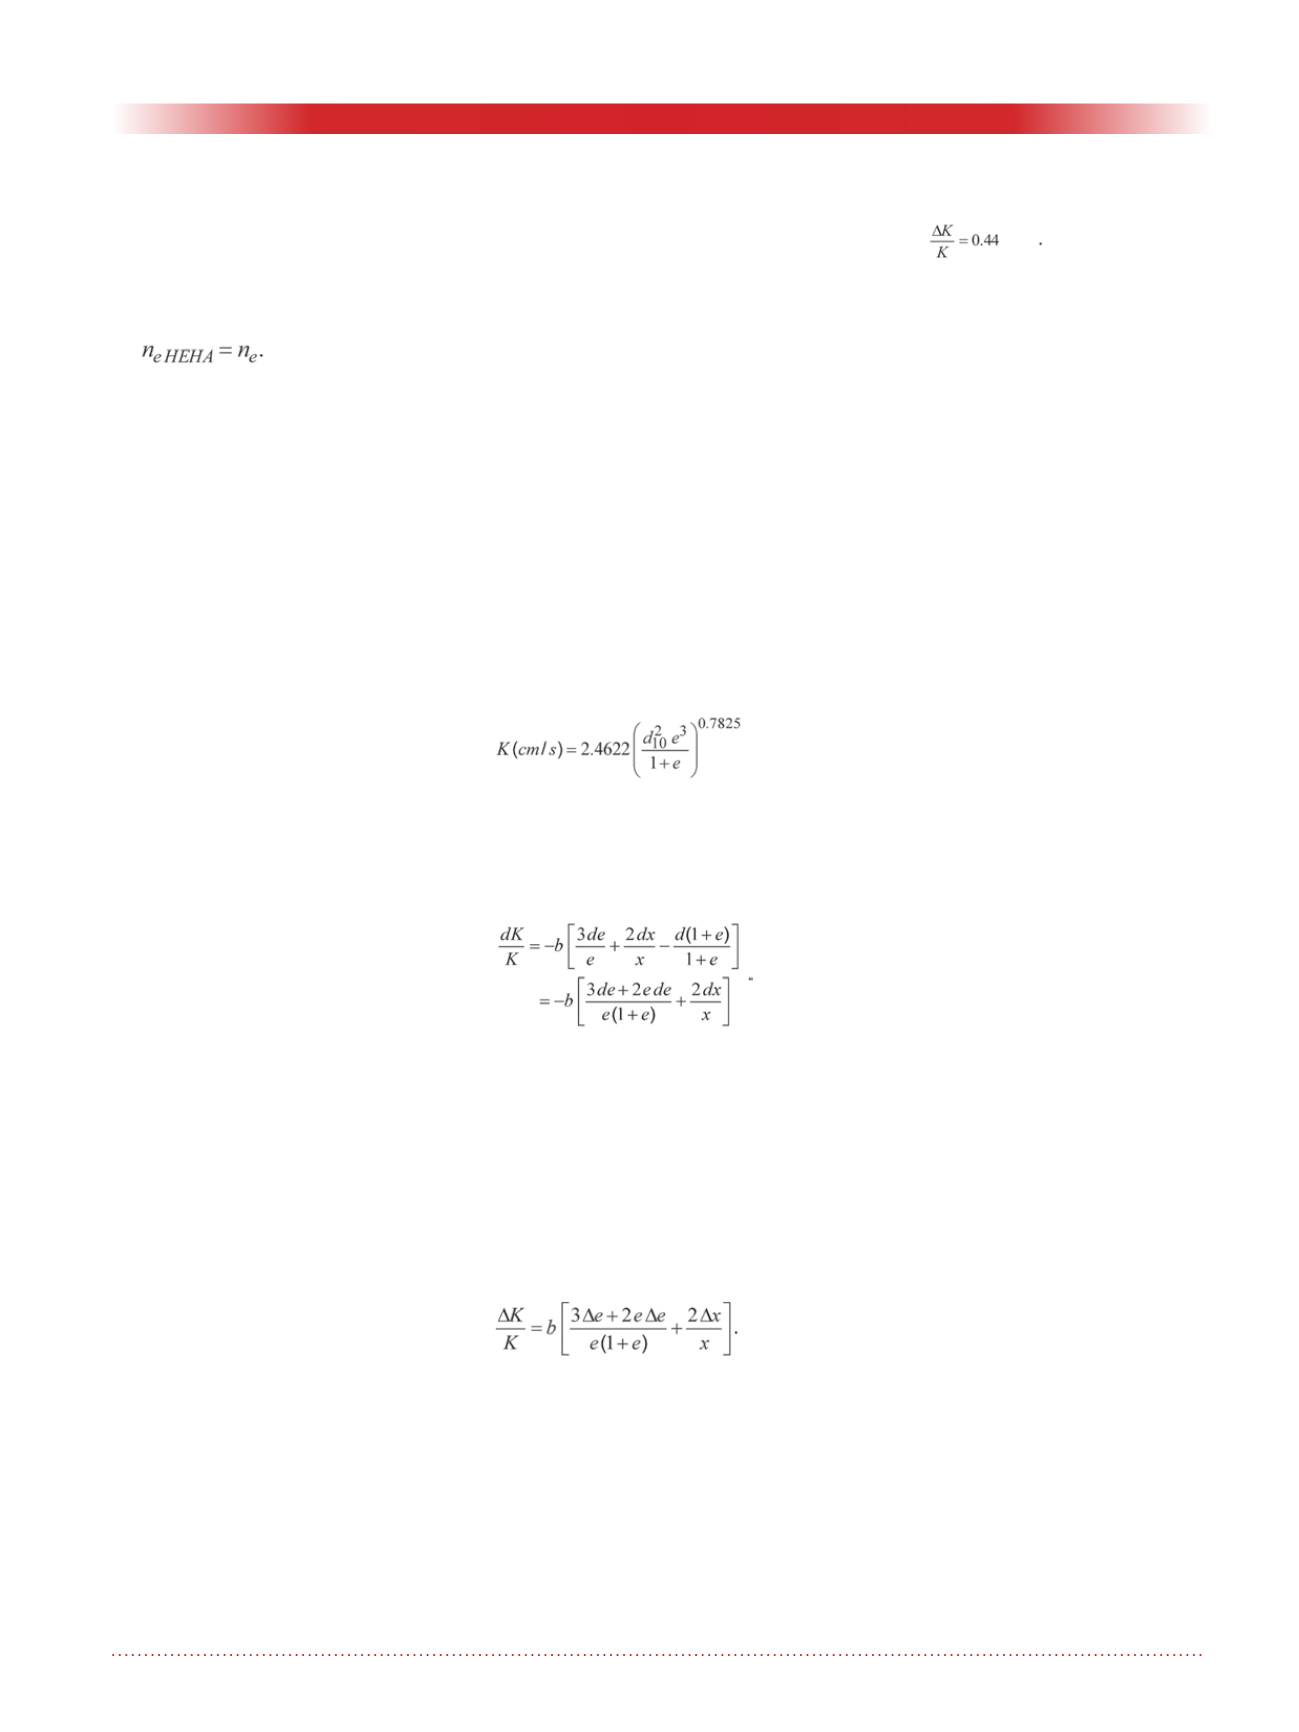
(2004). Here, eq. (3) is retained. It pre-
dicts
K
values between half and twice
the experimental
K
values for the tests
that avoided all of the common 14
mistakes of laboratory tests (Chapuis
2012b). Equation (3), where
d
10
is in
mm, gives a
K
value of 2.17 x 10
–4
m/s
for the mean values of
d
10
and
e
:
For simplification,
a
= 2.4622,
b
= 0.7825 and
d
10
=
x
; the logarithmic
differential of eq. (3) is:
Equation (4) is then used to assess the
relative error (
dK/K
) resulting from
the relative errors on
d
10
(
dx/x
) and
e
(
de/e
) when these values are small (≤
10%), and also the relative uncertainty
(
Δ
K/K
), where
Δ
K
is the absolute
value of
dK
. The equation for relative
uncertainties is:
The numerical application for the
previous sand data yields:
As a result,
K
= (2.2 ± 1) x 10
–4
m/s. However, because the variation
exceeds 20%, the direct calculation is
preferred and gives: 1.36 x 10
–4
≤
K
≤
3.27 x 10
–4
m/s.
Similar developments can be made
with the Hazen-Taylor and the
Kozeny-Carman equations.
Corresponding normal and lognormal
K
distributions appear in Fig. 2. With
μ
K
= 2.17 x 10
–4
m/s and
σ
K
= 4 x 10
–5
m/s, eq. (1) gives
α
L
= 0.58 mm, and
eq. (2) gives
n
e
=
n
. With
μ
ln
K
= –8.435
and
σ
ln
K
= 0.180, eq. (1) gives
n
e HEHA
= 0.984
n
. Such a high ratio
n
e HEHA
/ n
is regularly obtained with laboratory
tracer tests for sand or clay (Sevee
2010), and also with field tracer tests
limited to individual layers (Pickens
and Grisak 1981). These results sup-
port the lognormal assumption.
Consider now a poorly prepared tracer
test. The sand has large variations in
d
10
and
e
due to poor quality control.
This may double the previous
σ
K
and
σ
ln
K
, and thus quadruple the variances,
which gives
α
L
= 2.4 mm for the
normal
K
distribution,
α
L
= 1 mm and
n
e HEHA
= 0.937
n
for the lognormal
K
distribution. Because the
n
value is
inaccurate (poor control), the differ-
ence between
n
and
n
e
is inaccurate.
Therefore, one cannot differentiate a
well-prepared from a poorly-prepared
laboratory tracer test. In addition, the
differences resulting from the two
assumed
K
distributions, normal or
lognormal, are too small to tell which
distribution should be preferred for a
laboratory tracer test.
Field tests
Many field test data were collected
(e.g., Gelhar et al. 1992), but most
data are incomplete and cannot be
used to assess the predictive eq. (1).
Only a few complete sets of data
were found. To interpret the Cape
Cod tracer test in sand (LeBlanc et al.
1991; Garabedian et al. 1991; Hess et
al. 1992), it was assumed that
n
=
n
e
= 0.39. The
ln
(
K
) distribution had a
variance of 0.14 (laboratory tests) and
0.24 (flowmeter tests), yielding
σ
ln
K
= 0.37 to 0.49. Then, eq. (1) predicts
that the ratio of
n
e HEHA
/n
e
exceeds
(2)
(3)
(4)
(5)
(6)


