34
Geotechnical News • December 2016
WASTE GEOTECHNICS
Experience has shown that what is
required is detailed, site specific data
at scales of 1:1,000 to 1:5,000 (Som-
merville et al. 2016). How can this
detailed data be developed to help in
projects?
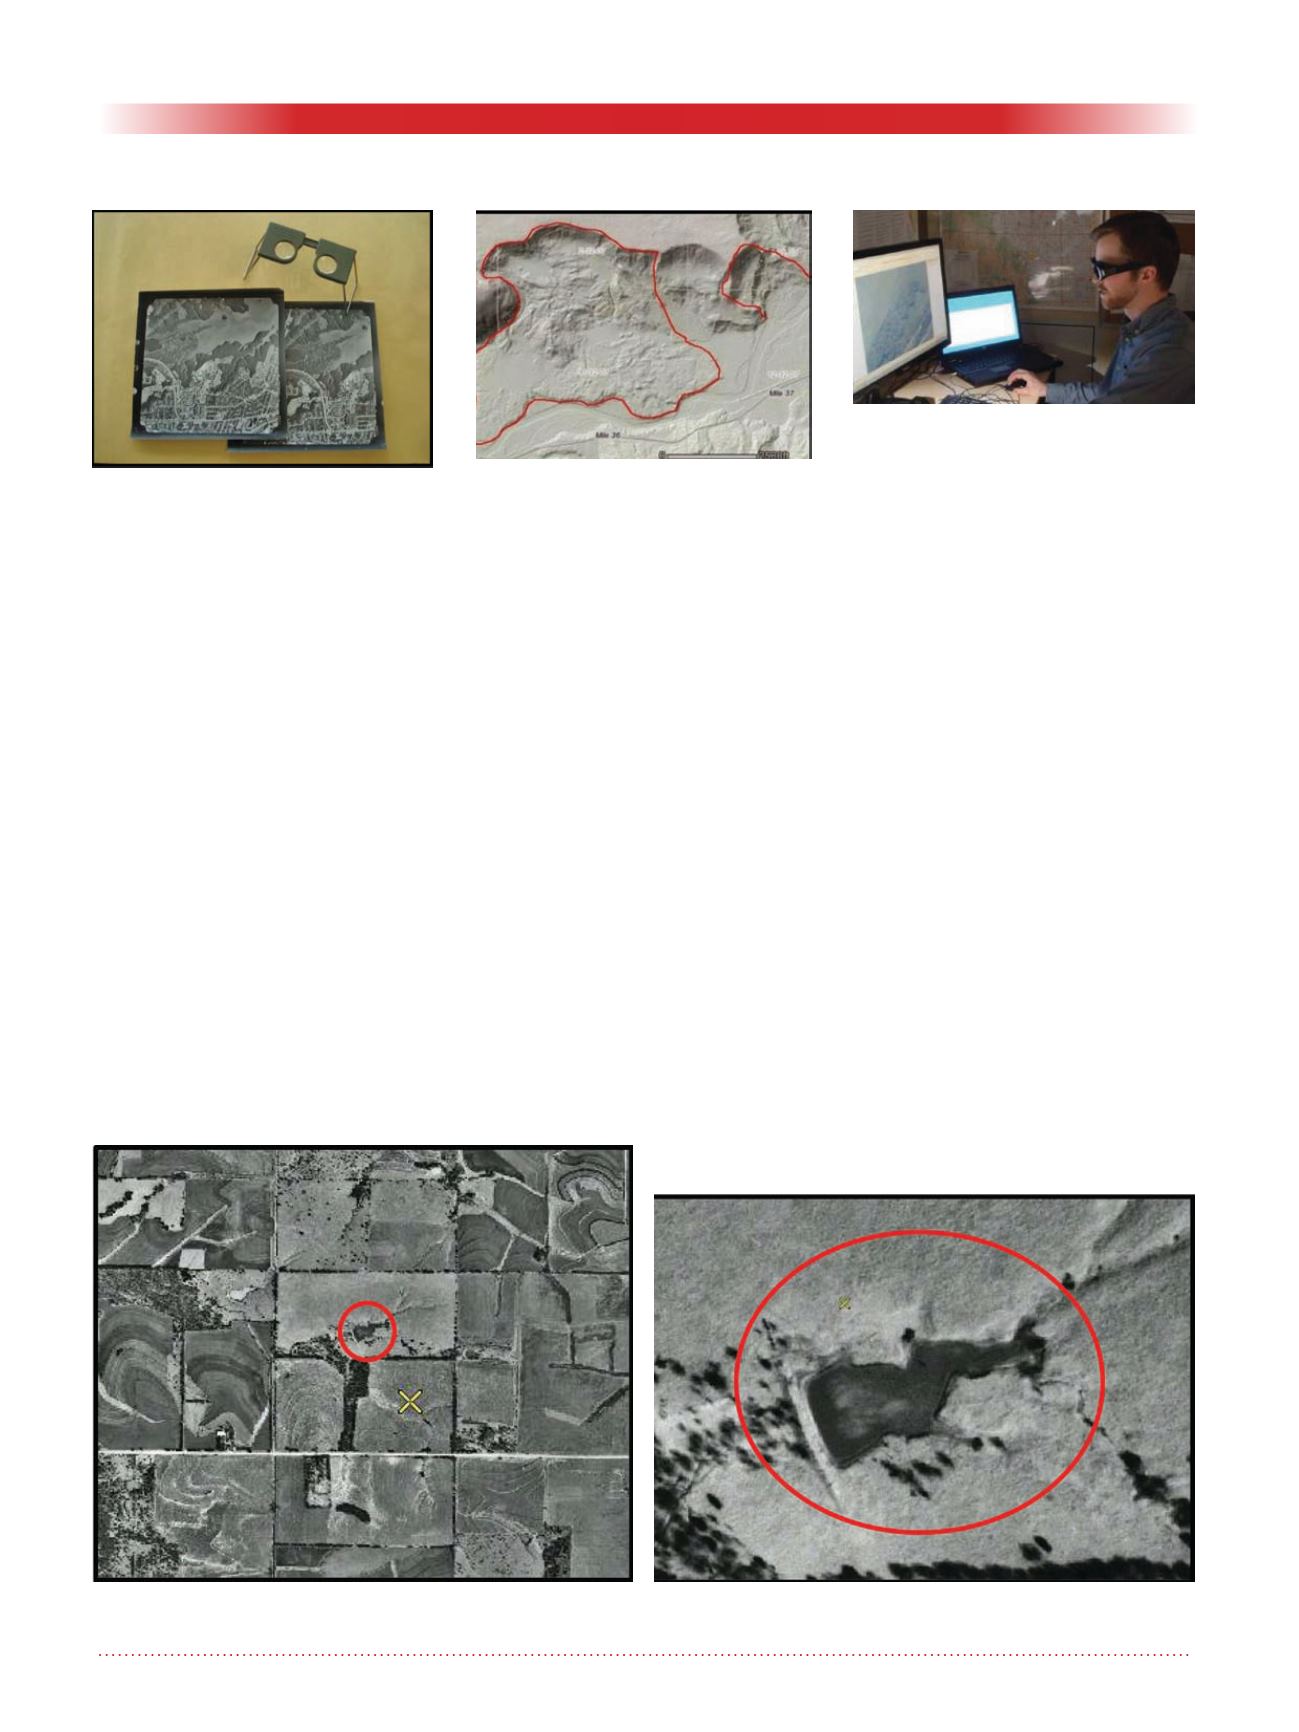
Traditionally, terrain scientists and
geotechnical engineers use hardcopy
aerial photographs and a stereoscope
(Figure 2) to identify and map terrain
features in 3D.
In recent years, the use of LiDAR
data has become more widespread as
a tool for terrain mapping. LiDAR
data is topographic data only and can
be viewed using hillshade models and
is a good tool to identify landslides
(Figure 3), steep slopes, fluvial envi-
ronments and sand dunes. However,
outside of these examples, LiDAR
provides very limited information to
determine soil materials and other
terrain attributes for most upland
environments. For example, drainage
regime (e.g., wet vs. dry), overburden
thickness (veneers vs. thick glacial
sediments) and areas of groundwater
seepage cannot be differentiated from
LiDAR data. (Figure 3).
LiDAR data, plus any other available
data (e.g., water well data, geotech-
nical borehole data, etc.) should be
used in conjunction with stereo aerial
photographs to help in initial site char-
acterization.
Unfortunately, mapping using this
traditional hardcopy aerial photo-
graphs is limited to the initial capture
scale (e.g., 1:40,000, 1:30,000) of the
aerial photographs and the stereo-
scope. Using 1:40,000 scale aerial
photographs produces 1:40,000 scale
mapping or smaller (e.g., 1:50,000,
1:63,360); 1:24,000 scale aerial
photographs result in 1:24,000 scale
products. The mapper is limited by
the technology and hence the detailed
data required for project development
is not possible at the desktop stage
unless extensive field investigations
have been completed.
Recent advances in photogrammetry
has resulted in the development of
softcopy technologies. Softcopy tools
allow geoscientists and geotechnical
engineers the ability to view tradi-
tional aerial photographs in a digital
environment using specialized 3D
glasses (Figure 4).
The main advantage of softcopy map-
ping tools is that the mapper is able to
zoom down from original scales such
as 1:24,000 or 1:40,000 to scales as
large as 1:2,000 or greater; from high
resolution digital imagery that has
commonly been flown over the past
decade, the mapper is able to zoom
down to scales as large as 1:350. This
Figure 2. Hardcopy aerial photo-
graphs and stereoscope.
Figure 3. LiDAR data showing area
of past landsliding
Figure 4. Softcopy mapping system.
Figure 5. 1:30,000 image, initial capture scale of the
aerial photo.
Figure 6. 1:30,000 scale image zoomed into at 1:2,000
scale.


