36
Geotechnical News • March 2019
WASTE GEOTECHNICS
molecules that went down at time 1
and the amount of molecules that went
up at time 2, then we can calculate a
net flux over a period of time (Burba,
2013).
Typical sampling rates for ECV
applications are in the order of 10 Hz
or higher, producing large amounts
of data. This data is processed via
applying a series of conversions and
corrections that are computer intensive
that at the end lead to the evaporation
rates.
One of the important characteristics of
the method is that the ECV instrumen-
tation has to be installed downwind
of the area of interest. The size of the
footprint, that is, from how far upwind
the ECV will be capturing data, will
depend on the height of the instrumen-
tation above the surface of interest
and its roughness. Another important
feature is that winds coming from any
direction different from the area of
interest can be filtered out using the
sonic anemometer wind direction data,
thus avoiding the contamination of
data from other areas.
A bit of history, applications and
advantages of the use of ECV
The ECV method has been around in
the scientific community for a couple
of decades. The theoretical develop-
ment of the method was done in 1948,
but it was not until 1962 that the
3D sonic anemometer and the water
vapor gas analyzer were available.
Only in 1988 a real-time data pro-
cessing software was developed, and
by the year 2000 a methodology and
the organization of an international
network (FLUXNET) was established
(Aubinet, 2012).
The ECV method has been widely
used to measure gaseous exchange
between the forests and the atmo-
sphere at different latitudes
worldwide. The Centre for Earth
Observation Sciences (CEOS) at
the University of Alberta, led by Dr.
Arturo Sánchez-Azofeifa, currently
operates two ECV stations that are
monitoring boreal
and tropical dry
forests.
The ECV method
is suitable for
measuring water
vapor fluxes in
large and flat
extensions of
areas, either veg-
etated or not. The
main restriction
is that the instru-
ments must be
located downwind
of the area of
interest. The main
advantages of the
method applied
in mining settings
are:
• It causes no disturbances on the
surface and can be used in tailings
ponds since it can be installed at
the edge of the TSF, downwind of
the area to be measured.
• Obtains spatially averaged fluxes
for areas with footprint fetches
ranging from 200 m to 800 m.
• It can provide flux estimations for
periods of hours to years, depend-
ing on how long the instrument is
deployed on site.
• It is the only method for actual
evaporation measurement that
enables quality assurance of the
obtained results through math-
ematical calculations (cospectra
analysis), leading to reliable
evaporation rates.
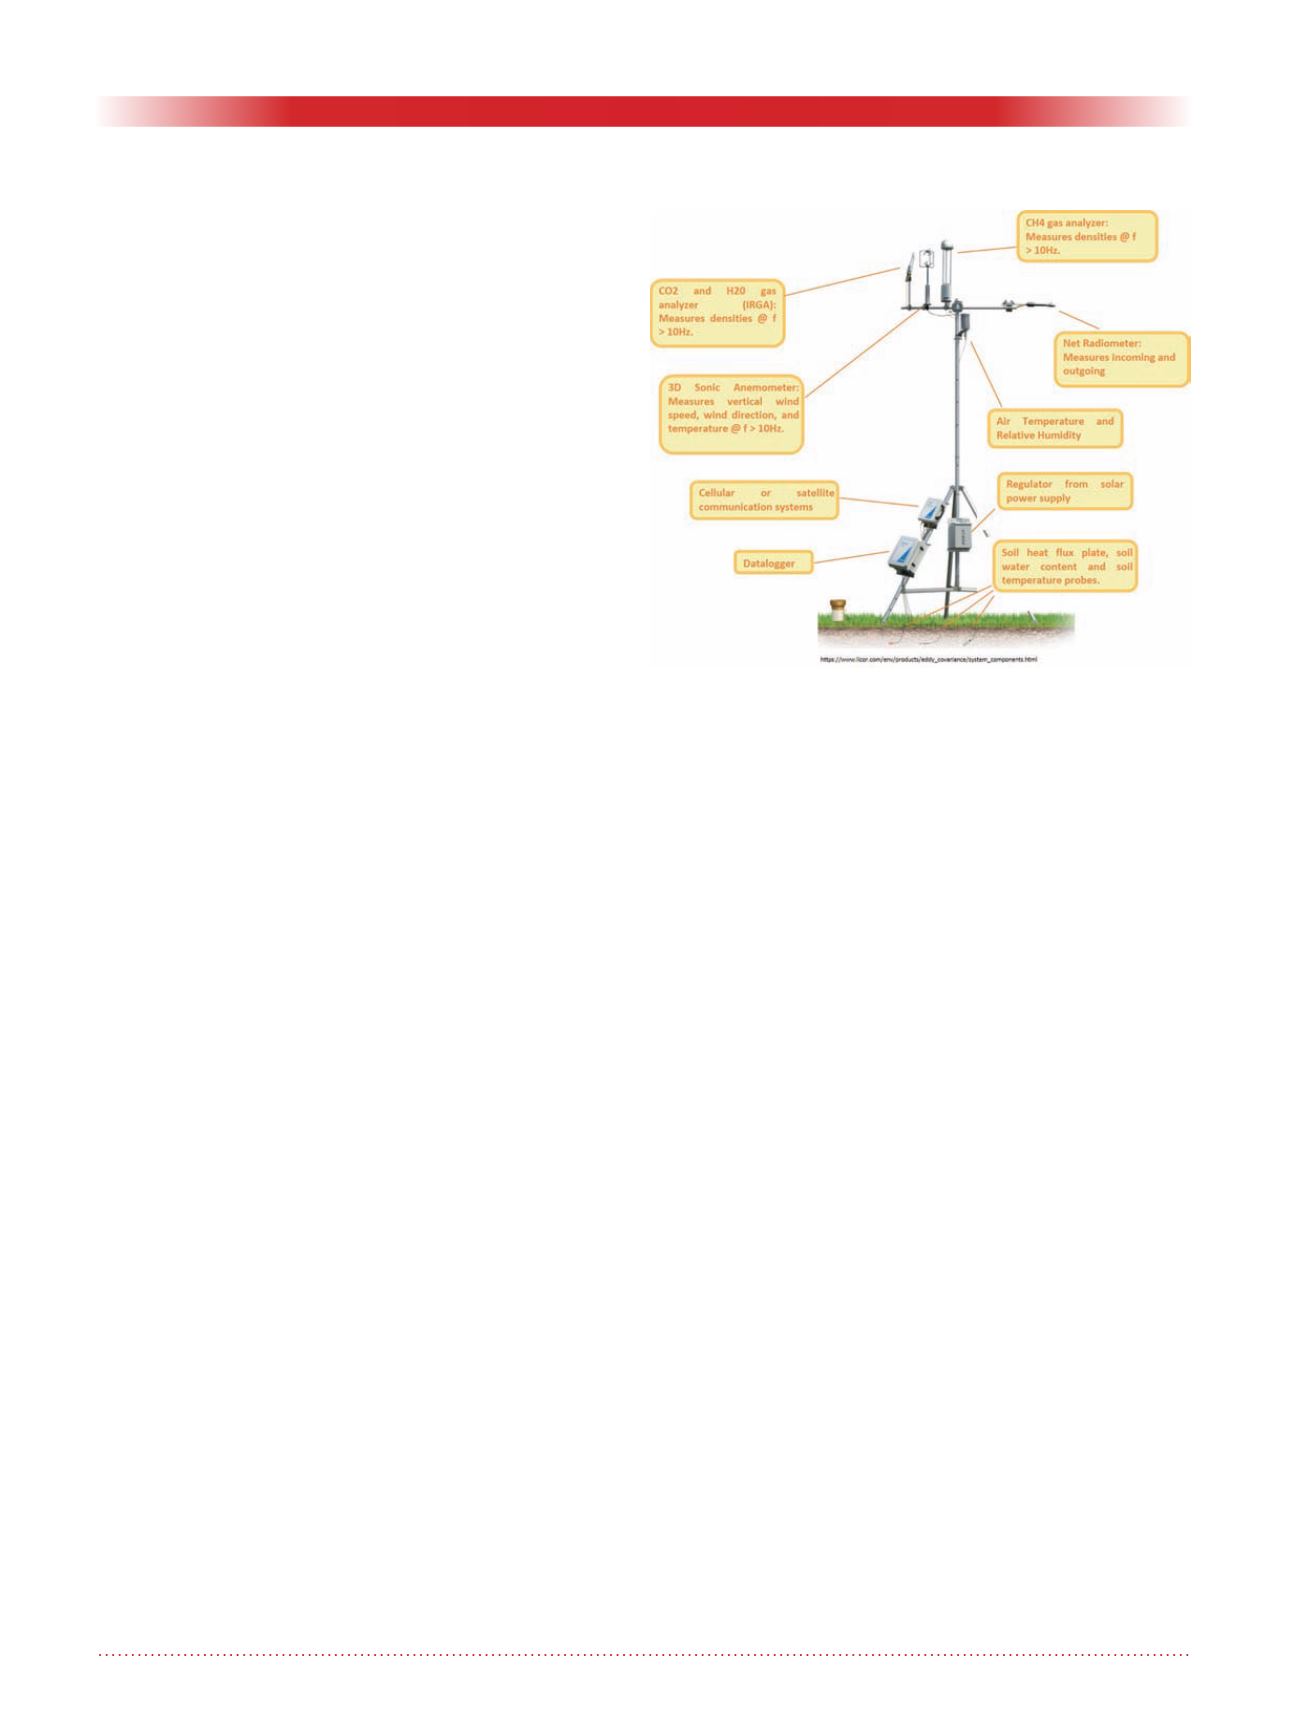
ECV equipment
The main components of the ECV
are the gas analyzer, which measures
water vapor and carbon dioxide con-
centrations, and the sonic anemometer
that measures wind speed and direc-
tion. Both instruments sample at fre-
quencies of at least 10 Hz in order to
capture small eddies (Foken, 2012). In
addition, the system has a datalogger
and a processor that is able to pre-pro-
cess and store the data collected from
the ECV. Also, meteorological data is
collected on site, and biosensors are
installed in the ground. Figure 1 shows
a typical ECV set up:
In addition to water vapor and carbon
dioxide measurements, a methane gas
analyzer can be added. The system,
if provided with a cellular or satellite
communication package, can be moni-
tored remotely, allowing for real-time
data collection and processing.
Finally, depending on the type of sur-
face where the ECV will be installed
(e.g. tailings or waste rock dump),
an additional energy balance closure
check could be performed. This can
be conducted using the measurements
of net radiation and ground heat flux,
together with the latent and sensible
heat fluxes measured by the ECV. For
this reason, a net radiometer and a soil
heat flux plate are usually considered
for typical site deployment.
Ongoing research
The Department of Civil and Environ-
mental Engineering at the University
of Alberta is currently conducting
research supervised by Professor G.
Ward Wilson in collaboration with
Dr. Sánchez-Azofeifa and led by PhD
student Sebastián Fernández to adapt
and apply the ECV method on mine
Figure 1: Typical ECV set up. Source:
.
com/env/products/eddy_covariance/system_compo-
nents.html.


