Geotechnical News • March 2015
33
GEOTECHNICAL INSTRUMENTATION NEWS
the volume of extracted travertine has
substantially increased over the last
thirty years. The travertine hosts an
aquifer; therefore, the consequent min-
ing of travertine includes groundwater
drainage. In 2008, the flow rate of this
drainage system was approximately
4m
3
/sec.
In certain parts of the area travertine is
outcropping, whereas highly com-
pressible soils (fine-grained deposits
with organic matter and soil-travertine
mixed deposits) overlay travertine in
other areas. The thickness of the com-
pressible deposits range between tens
of centimetres to tens of metres. These
deposits are hydraulically connected to
the travertine-hosted aquifer.
In designing a distributed monitor-
ing system to monitor the evolution
of subsidence in this region, we first
attempted to develop a comprehen-
sive understanding of the ongoing
geological/geotechnical process. A
large database of existing geological,
geotechnical and hydrogeological
information was created. The temporal
evolution of the ground displacement
from 1992 to 2010 was determined
using SAR satellite images (ERS
and ENVISAT satellites provided by
the ESA (European Space Agency))
with the advanced-differential inter-
ferometric synthetic aperture radar
(A-DInSAR) technique. A hydrogeo-
logical model that was calibrated and
validated using long-term piezometric
data was utilised to reproduce the
groundwater drawdown in the studied
area.
All collected information was pro-
cessed and combined (see Figures 5
and 6). Groundwater drawdown was
the primary cause of the recorded
subsidence, in which the thicknesses
of the compressible deposits primarily
controlled the extent of subsidence.
Throughout the investigated area,
the onset of subsidence was strictly
related to the groundwater cone
depression, whereas the amount of
ground displacement was related to
the thicknesses of the compressible
deposits (Figure 6).
Additional useful information was
obtained from a monitoring test that
spanned one year and was performed
in a representative area. For this
purpose, an open standpipe piezom-
eter monitored the groundwater in
the travertine, a multipoint electri-
cal resistance piezometer recorded
pore water pressure in the overlay-
ing compressible deposits and in the
travertine and a borehole equipped
with a probe magnetic extensometer
was used to monitor settlements. A
significant relationship was inferred
from the collected data, i.e., subsid-
ence occurs when the groundwater
level decreases, whereas uplift occurs
when the groundwater level increases.
A negligible time-delay between the
decreased groundwater level and sub-
sidence was observed.
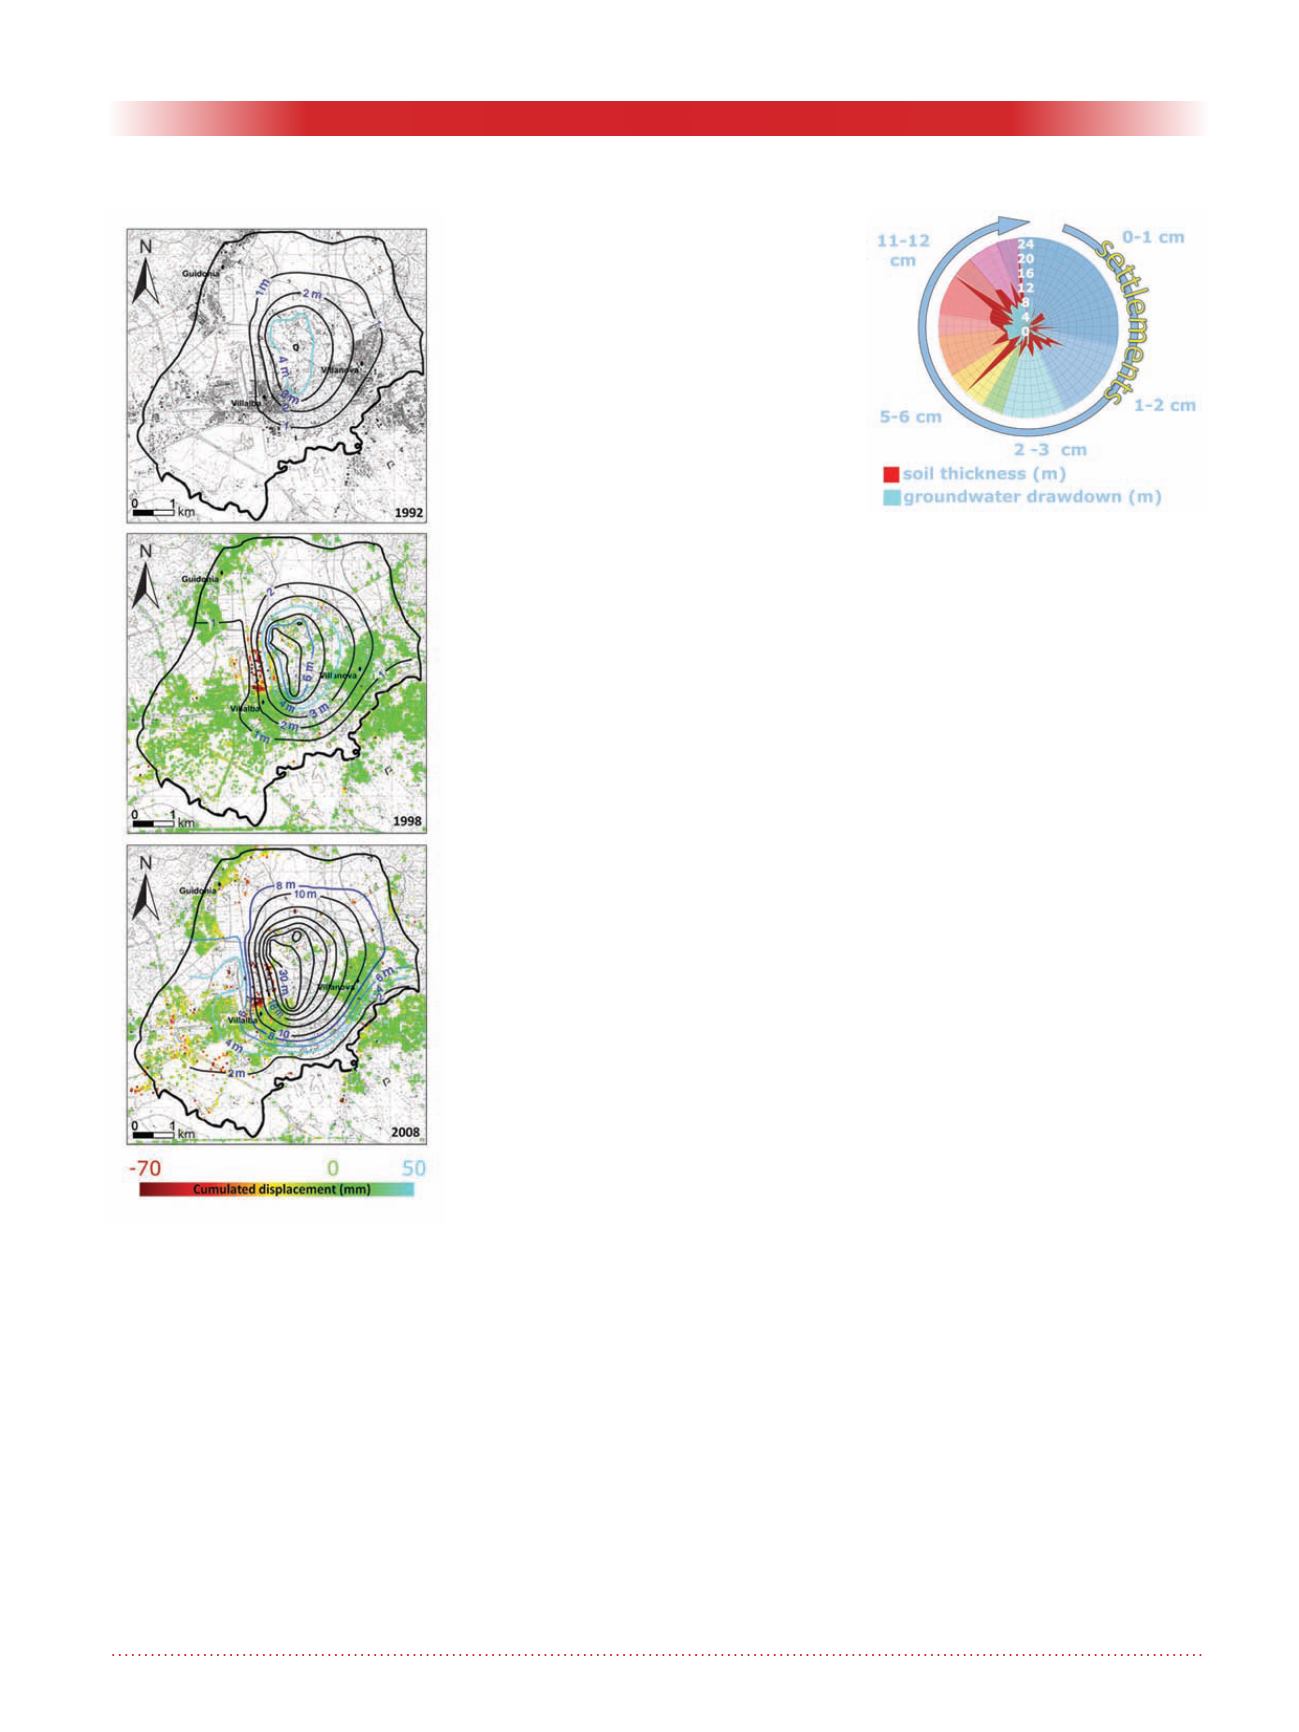
Figure 6. Plot showing the interpre-
tation of the subsidence process.
97 small areas (50m
2
) are selected
as geologically representative. Each
one is represented by a circular
sector in the graph and ordered
clockwise with respect to the settle-
ment measured from 1992 to 2008.
The over layered red and blue rose
diagrams (the labels in m are along
the NS radius) respectively indicate
the thickness and ground water low-
ering for each areal parcel. In this
plot it is possible to directly com-
pare the intensity of the predispos-
ing (thickness) and triggering (water
lowering) factors with the induced
effect (settlement).
Figure 5. Groundwater depres-
sion cone in 1992, 1998 and 2008
reconstructed using a numerical
model calibrated on a large piezo-
metric dataset. The black lines
represent iso-lowering lines with
respect to the groundwater level in
1954. The estimated total displace-
ment (coloured symbols) since
1992 based on the A-DInSAR tech-
nique is superimposed on the 1998
and 2008 maps.


