46
Geotechnical News • June 2016
GROUNDWATER
two other reasons were retained in the
1980s field investigations following
the poor performance of the liners.
The results of the two full-scale leak-
age tests showed that the leakage was
reduced when the water levels reached
mid-slope. Because the water thick-
ness above the liner had been halved,
the leakage rate should have been
roughly halved. However, this was
not the case. Leakage rates were only
1-2 mm/d (these small values were
inaccurate) and thus, much less than
half the leakage rate at full water level.
These findings led the author, acting
as an expert in the 1980s, to suspect
that mid-slope pipes were improperly
sealed or the upper parts of the liners
were too permeable.
A possible indication of damage in
the upper parts of the liners was found
in the July report of the construction
inspector who reported cracking in
the upper slopes. The engineer then
requested a verification that the cracks
would not be more than 3 to 5 cm
deep, otherwise the contractor would
have to spray water to increase the
clay water content, re-mix the 15-cm
clay lift, and re-compact it. This may
have been done, but there was no writ-
ten evidence of this in subsequent field
reports. In addition, the two lagoons
did not receive rain water or water
spraying during weeks between the
end of their construction and the full-
scale leakage tests. This situation was
physically detrimental to the liners.
A few weeks after the full-scale tests,
all participants in the project agreed
to empty the two lagoons. This was
needed so that the reasons for the poor
performance could be investigated.
Field verifications of the liners
and pipes
After the full-scale leakage tests, the
lagoons were emptied for inspection.
Shelby clay samples were taken in the
upper slopes. The liner thickness in
the upper slopes, supposed to be 75
cm, was only 45 cm on average for
liner No. 1, and 40 cm for liner No. 2.
The measured values ranged from 29
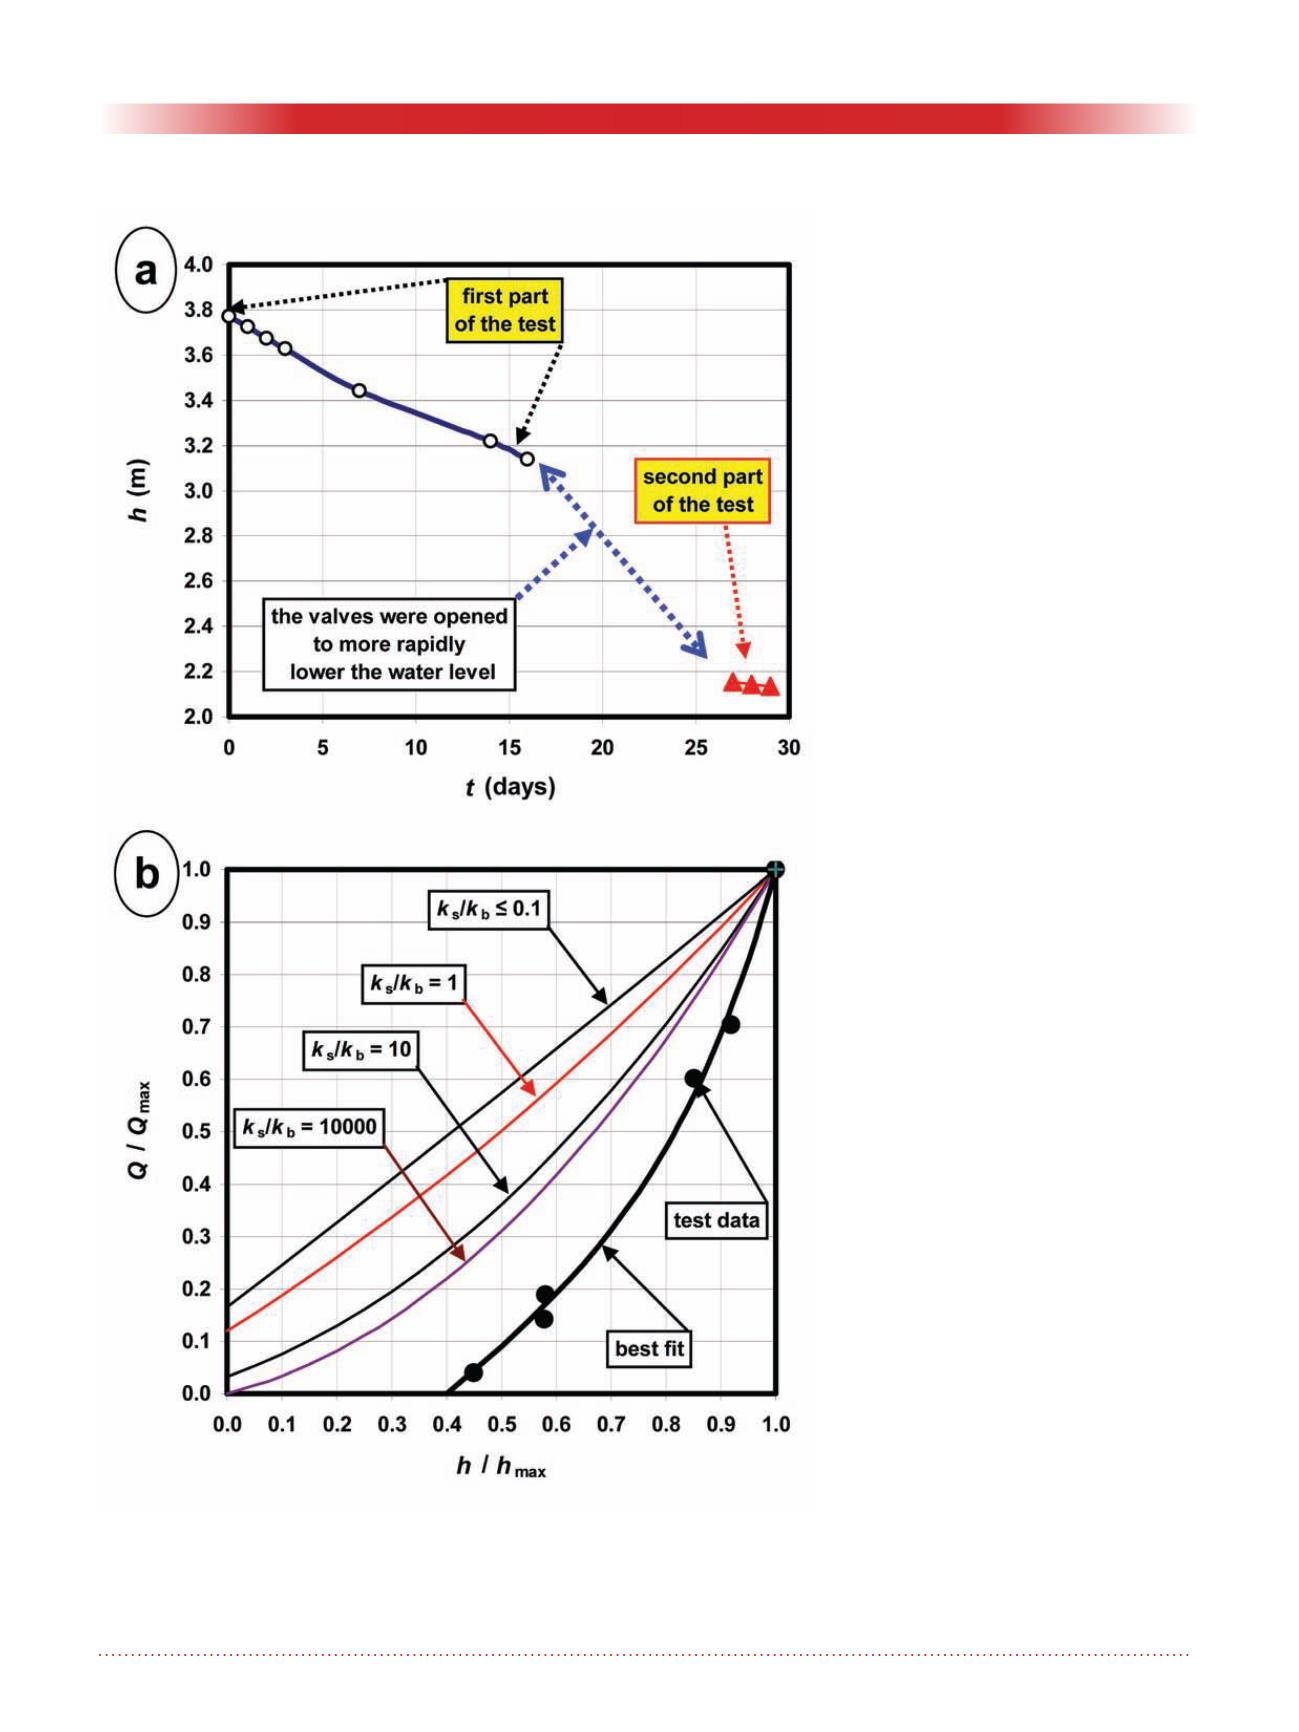
Figure 2 Full-scale leakage test, lagoon 1: (a) water level versus time; (b)
non–dimensional graph of relative flow rate Q/Qmax versus relative water
thickness h/hmax for the same lagoon geometry.


