 
        
          
            Geotechnical News • June 2016


              45


            GROUNDWATER


            w


          between 36% and 41%) below the
        
        
          liquid limit,


            w


            L


          , and a specific grav-
        
        
          ity of solids,


            G


            s,


          of 2.78. A standard
        
        
          Proctor test gave an optimum,


            ρ


            opt


          = 1587 kg/m
        
        
          3
        
        
          at


            w


            opt


          = 23.8%. The
        
        
          specifications required that


            ρ


            d


            c


          ≥ 90%


            ρ


            opt


          ,
        
        
          and


            w


            c


          ≥ 23.8%, after compaction.
        
        
          There was no specification for


            S


            r


          after
        
        
          compaction,


            S


            rc


          . The total leakage
        
        
          rates had to be lower than target values
        
        
          defined as a water level drop of 1 cm/d
        
        
          in lagoon 1, and 2 cm/d in lagoon
        
        
          2. The different values were related
        
        
          to the environmental impact evalua-
        
        
          tion made at the time (1980s) by the
        
        
          designing engineer.
        
        
          The total leakage rate of each lagoon
        
        
          was measured by monitoring the
        
        
          water level versus time after the
        
        
          valves on influent and effluent pipes
        
        
          were closed. The water levels were
        
        
          measured to the nearest mm within
        
        
          hydraulic structures connected to the
        
        
          lagoons. This eliminated wave effects.
        
        
          The levels were corrected for rain and
        
        
          evaporation, using rain gauges and
        
        
          evaporation pans.
        
        
          None of the liners passed the test. For
        
        
          lagoon No.1 at full water level, the
        
        
          drop was 5 cm/d, five times higher
        
        
          than required. For lagoon No.2 at full
        
        
          water level, the drop was 10 cm/d, five
        
        
          times higher than required. Leakage
        
        
          rates were measured at different water
        
        
          levels in the ponds.


              Full-scale leakage test – lagoon no. 1


          The water level versus time is shown
        
        
          in Fig. 2a. The total flow rate is noted


            Q


          for a water height


            h


          above the top of
        
        
          the bottom liner. It takes a maximum
        
        
          value


            Q


            max


          for a maximum value of


            h,


            h


            max


            .


          The ratio


            Q/Q


            max


          versus


            h/h


            max


          is plotted in Fig. 2b. The theoretical
        
        
          curves in Fig. 2b are those given by
        
        
          the closed-form equations of Chapuis
        
        
          (1990a), which involve two hydraulic
        
        
          conductivities,


            K


            b


          for the bottom part
        
        
          and


            K


            s


          for the sloping part of the liner.
        
        
          The initial water level drop was about
        
        
          5 cm/d, 5 times higher than the target
        
        
          value. Figure 2b helps to identify
        
        
          the nature and location of hydraulic
        
        
          defects. The field results (Fig. 2) could
        
        
          have three explanations:
        
        
          1. The liner could have been fissured
        
        
          when the water level exceeded a
        
        
          certain elevation. This can occur
        
        
          if the liner rests on a low bearing
        
        
          capacity soil: the large uneven
        
        
          settlement creates fissures in the
        
        
          liner. The cracks stay opened when


            h/h


            max


          exceeds a certain value,
        
        
          but may close when the water
        
        
          level drops. For the two lagoons,
        
        
          however, the underlying soils were
        
        
          dense till with a very small settle-
        
        
          ment, which would lead to discard
        
        
          this first explanation.
        
        
          2. According to Fig. 2b, the upper
        
        
          portion of the sloping liner was too
        
        
          pervious. In this case, the leakage
        
        
          rate depends on the difference in
        
        
          elevation between the pond surface
        
        
          and the bottom of the damaged
        
        
          zone, which would explain the
        
        
          shape of Fig. 2b. This explana-
        
        
          tion (damaged upper portion) was
        
        
          proposed in the 1980s, after it
        
        
          was noted that the half-full lagoon
        
        
          leakage was much smaller than
        
        
          half of the full lagoon leakage.
        
        
          3. The elevation at which the leak-
        
        
          age seemed to vanish was equal,
        
        
          within a few centimetres, to that of
        
        
          the base of the influent and effluent
        
        
          pipes crossing the liner. Therefore,
        
        
          the shape of Fig. 2b could also be
        
        
          due to preferential leakage along
        
        
          poorly sealed pipes. This explana-
        
        
          tion (poorly sealed pipes) was pro-
        
        
          posed in the 1980s after noting that
        
        
          the leakage rate nearly vanished
        
        
          when the lagoon was half-full, thus
        
        
          for water below the elevation of
        
        
          the pipes.


              Full-scale leakage test – lagoon no. 2


          The water level versus time appears
        
        
          in Fig. 3a and


            Q/Q


            max


          versus


            h/h


            max


          in
        
        
          Fig. 3b. The initial water level drop
        
        
          was about 10 cm/d, 5 times higher
        
        
          than the target value. Fig. 3b shows
        
        
          that the leakage rate seems to van-
        
        
          ish when


            h/h


            max


          reaches 37.5%. The
        
        
          discrepancy between predicted and
        
        
          measured leakage rates could be due
        
        
          to the same three reasons as for lagoon
        
        
          No. 1. Here again, the elevation at
        
        
          which the leakage seemed to vanish
        
        
          was equal to that of the base of the
        
        
          pipes crossing the liner. The first rea-
        
        
          son (settlement) was discarded but the


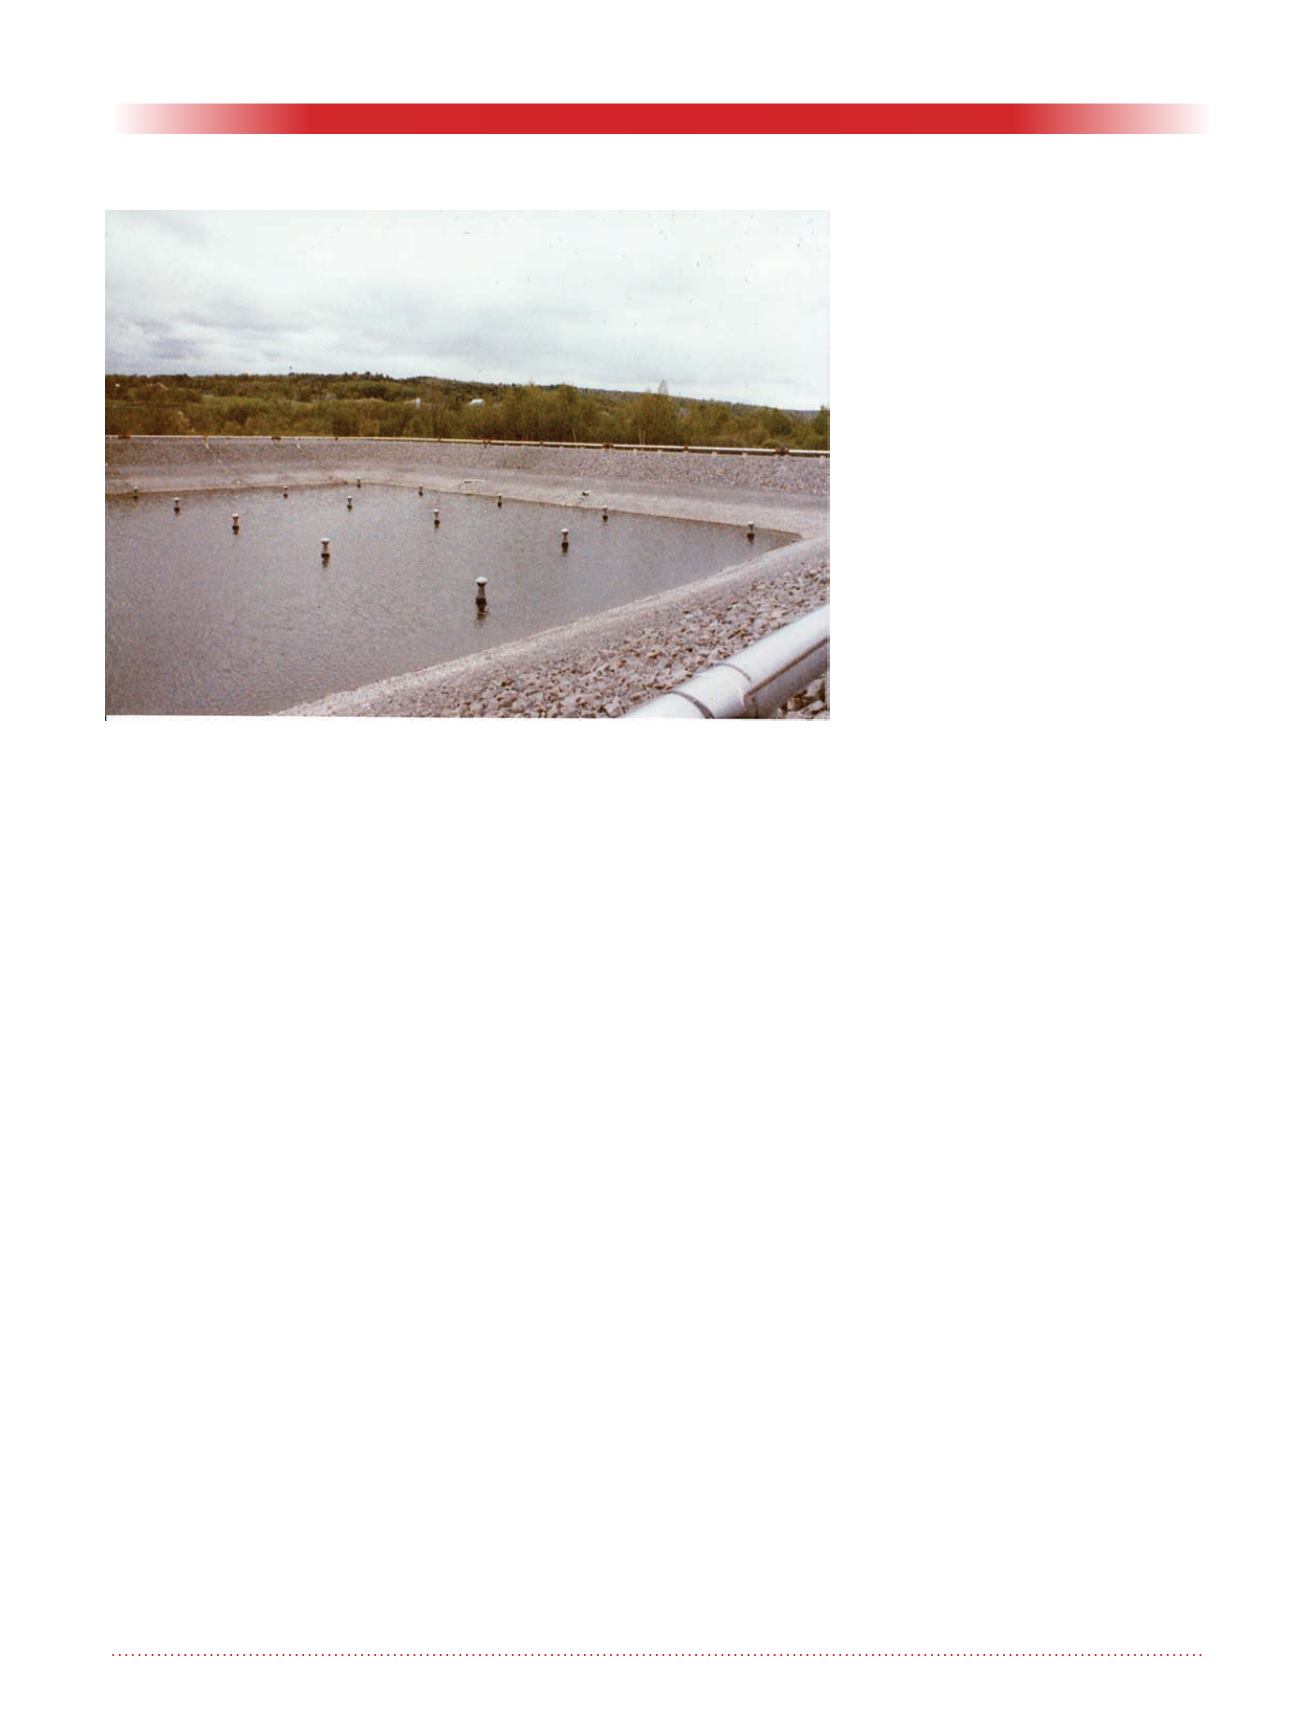
            Figure 1. Example of half-full lagoon for wastewater treatment (photo by


            author). The pipe (bottom right and along the crest of the dike) provides air


            to the aerators, the upper part of which emerges in the partially filled lagoon.


            Two influent or effluent pipes can be seen above the water line.