28
Geotechnical News • June 2017
THE GROUT LINE
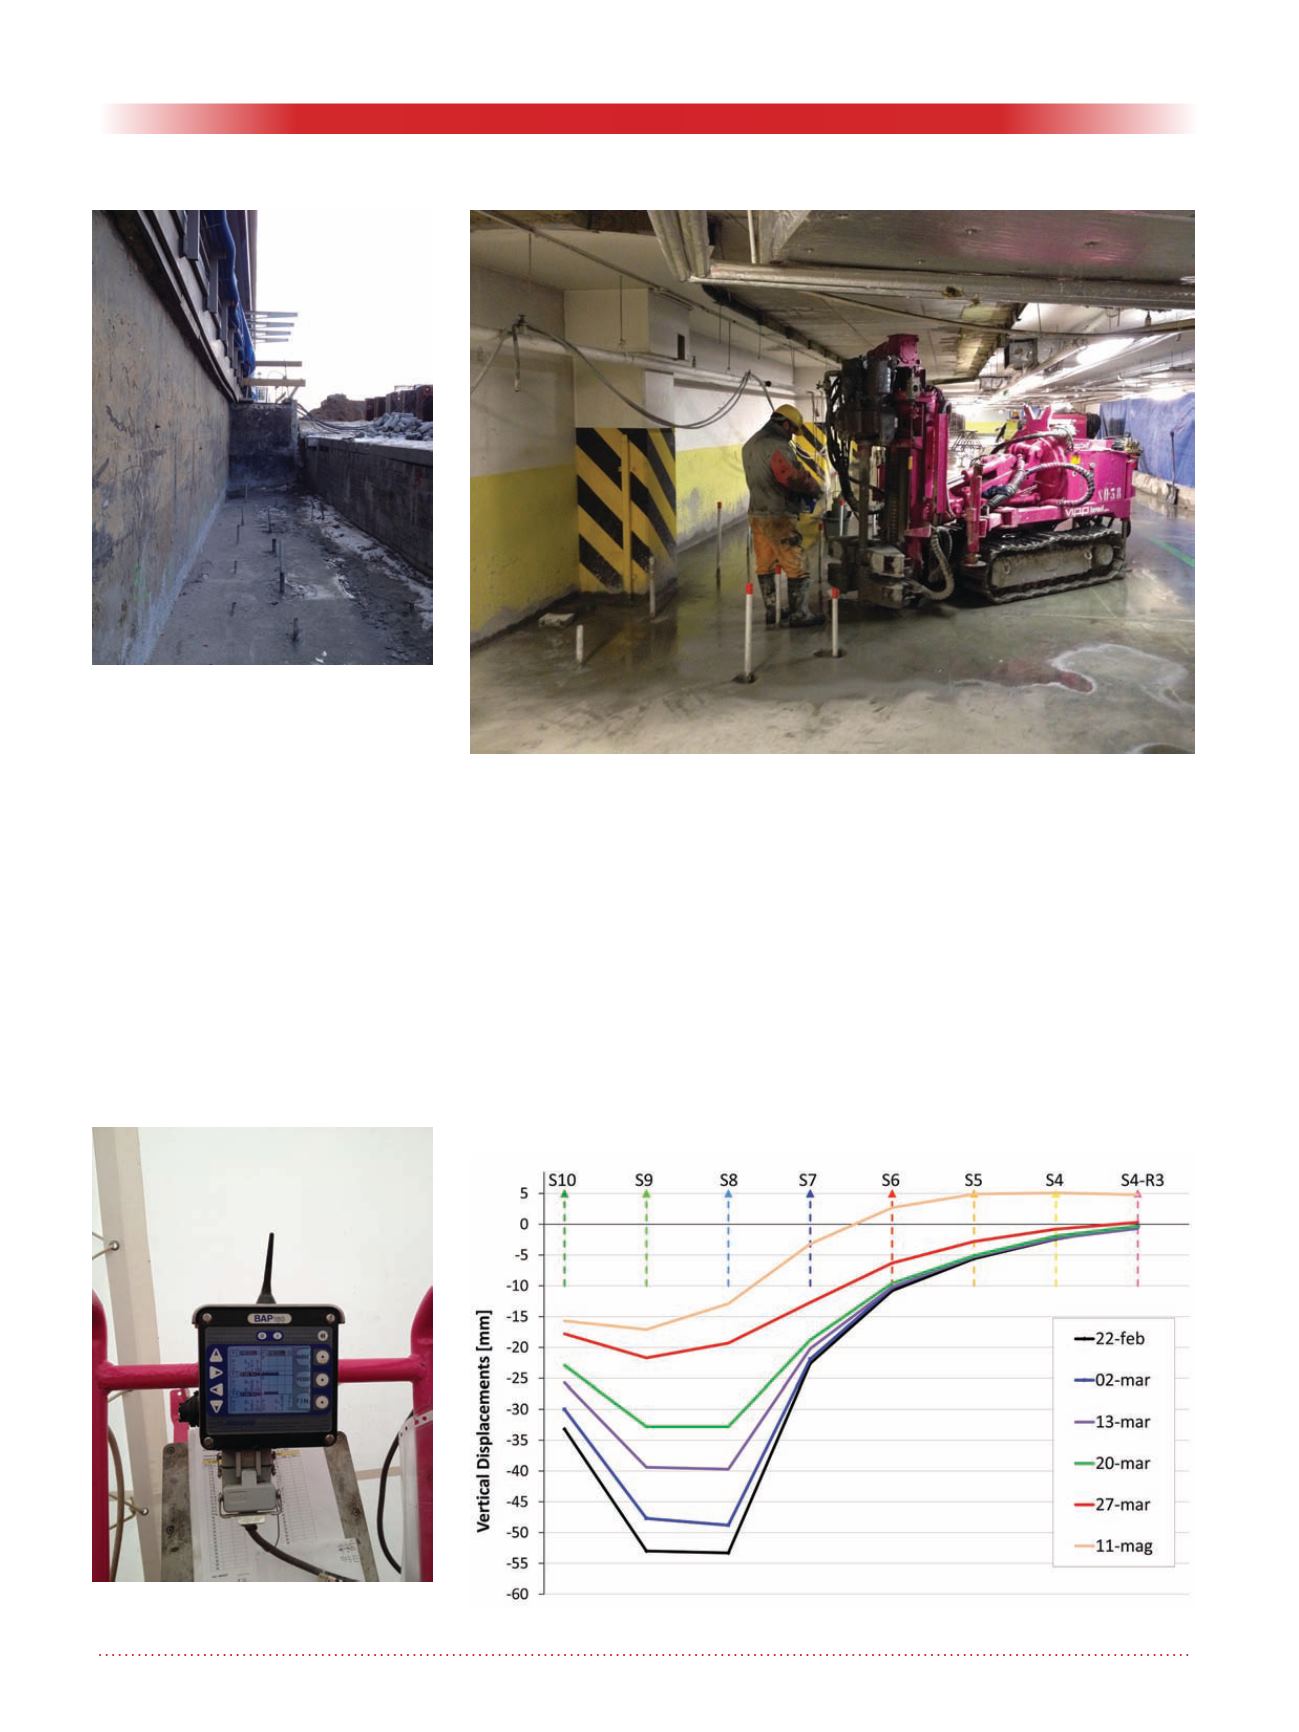
underground floor, in narrow spaces
(the average height was 2,30 m) (Fig.
7).
The structures were controlled by an
automatic topographic monitoring
system (Fig.8); optical prisms were
placed in correspondence of each
pillar.
The grouting scheme was studied in
order to gradually uplift the structure’s
pillars; in some cases even the specific
order of the sleeves to be injected
was indicated. On the first day, a set
of holes was drilled and the sheath
injection executed. On the following
day, the first stage of the injection,
using cement grout, was carried out.
The monitored points were regularly
checked. The operative parameters
were recorded in real time and the
pressure and volumes evaluated at
the end of each working day. In some
cases, the data analysis involved
rescheduling the grouting sequence
of the following days. The continuous
and constant monitoring and recording
of the grouting parameters influenced
the timing and scheduling of the proj-
ect. On several occasions the weekly
scheduling was modified based on the
results obtained day by day. In some
cases, the weekly programming was
modified based on the data and results
obtained on a specific day.
The chart of figure 9 shows the evolu-
tion of the vertical displacements
measured during the works. Firstly the
grouting with cement mix gradually
uplifted the pillars nr. 8 and 9.
Figure 6.Two rows of TAM outside
the structure, installed from a
lowered existing level.
Figure 7.Drilling works from the underground parking inside the building.
Figure 8.Topographic monitoring
system.
Figure 9. Pillars’ displacements during the grouting works.


