Geotechnical News • June 2017
21
GEOHAZARDS
study of the deposit and the collapse
scar we processed oblique helicopter
digital photos taken with a standard
SLR camera. For the observations of
the flank prior to the collapse, we used
digitized historical vertical aerial pho-
tos. We processed both oblique photos
and vertical historical aerial photos
with the commercial SfM software
package PhotoScan. SfM is a powerful
tool for geologists and geomorpholo-
gists and quickly becoming standard
technique in interpretive geoscience.
Structure from Motion
Originally, Structure from Motion
(SfM) refers to the computing vision
problem of reconstructing the geom-
etry of an object (Structure) from a
moving sensor (Motion). With the
use of SfM, the three-dimensional
geometry of scenes and objects can
be retrieved from sequential two-
dimensional images by measuring
geometric differences between images.
In geoscience, SfM refers to a com-
posite workflow of Structure from
Motion and Multi View Stereo (MVS)
algorithms. The SfM process matches
features between images, estimates
the camera position and parameters,
and delivers a sparse point cloud in
generic x, y, z object coordinates. The
MVS increases the number of matches
to generate a denser point cloud. The
point cloud can be then georeferenced
by adding ground control points
(GCP) and interpolated to generate
digital elevation models (DEM).
The use of SfM does not require
specialized personnel or expensive
software, making three-dimensional
modelling accessible to everyone. This
technique is broadly applied from the
hand-sample reconstruction to outcrop
modelling and medium scale topogra-
phy generation. SfM-derived DEMs
have been proven to be of comparable
quality to Lidar DEMs. While SfM is
most often used with imagery taken
from a hand-held camera or unmanned
aircraft vehicles (UAV)few studies
have explored the application with his-
torical aerial photos. Limitations exist
related to the automated workflow
where errors are difficult to identify
and control, however, recent work has
focused on assessing and reducing
such errors allowing broader accep-
tance of SfM
SfM allows for a rapid and high-
resolution cartographic production
effective in the assessment of natural
disasters. For landslides it can be used
to generate post-event topography, to
get sequential DEMs of slow moving
landslides, or to perform kinematic
analysis of joints and discontinuity
sets.
There are many open source and
commercial SfM packages available.
We used PhotoScan to reconstruct the
2010 Mt Meager landslide deposit,
landslide scar and the slope distress of
the flank prior to the collapse. Photo-
scan includes, in a single package, the
whole workflow from image match-
ing to orthophoto and DEM extrac-
tion, allowing point cloud and mesh
editing. Its efficiency, straightforward
workflow, and a user-friendly interface
has made Photoscan successful with
a wide scientific literature to prove its
reliability and precision.
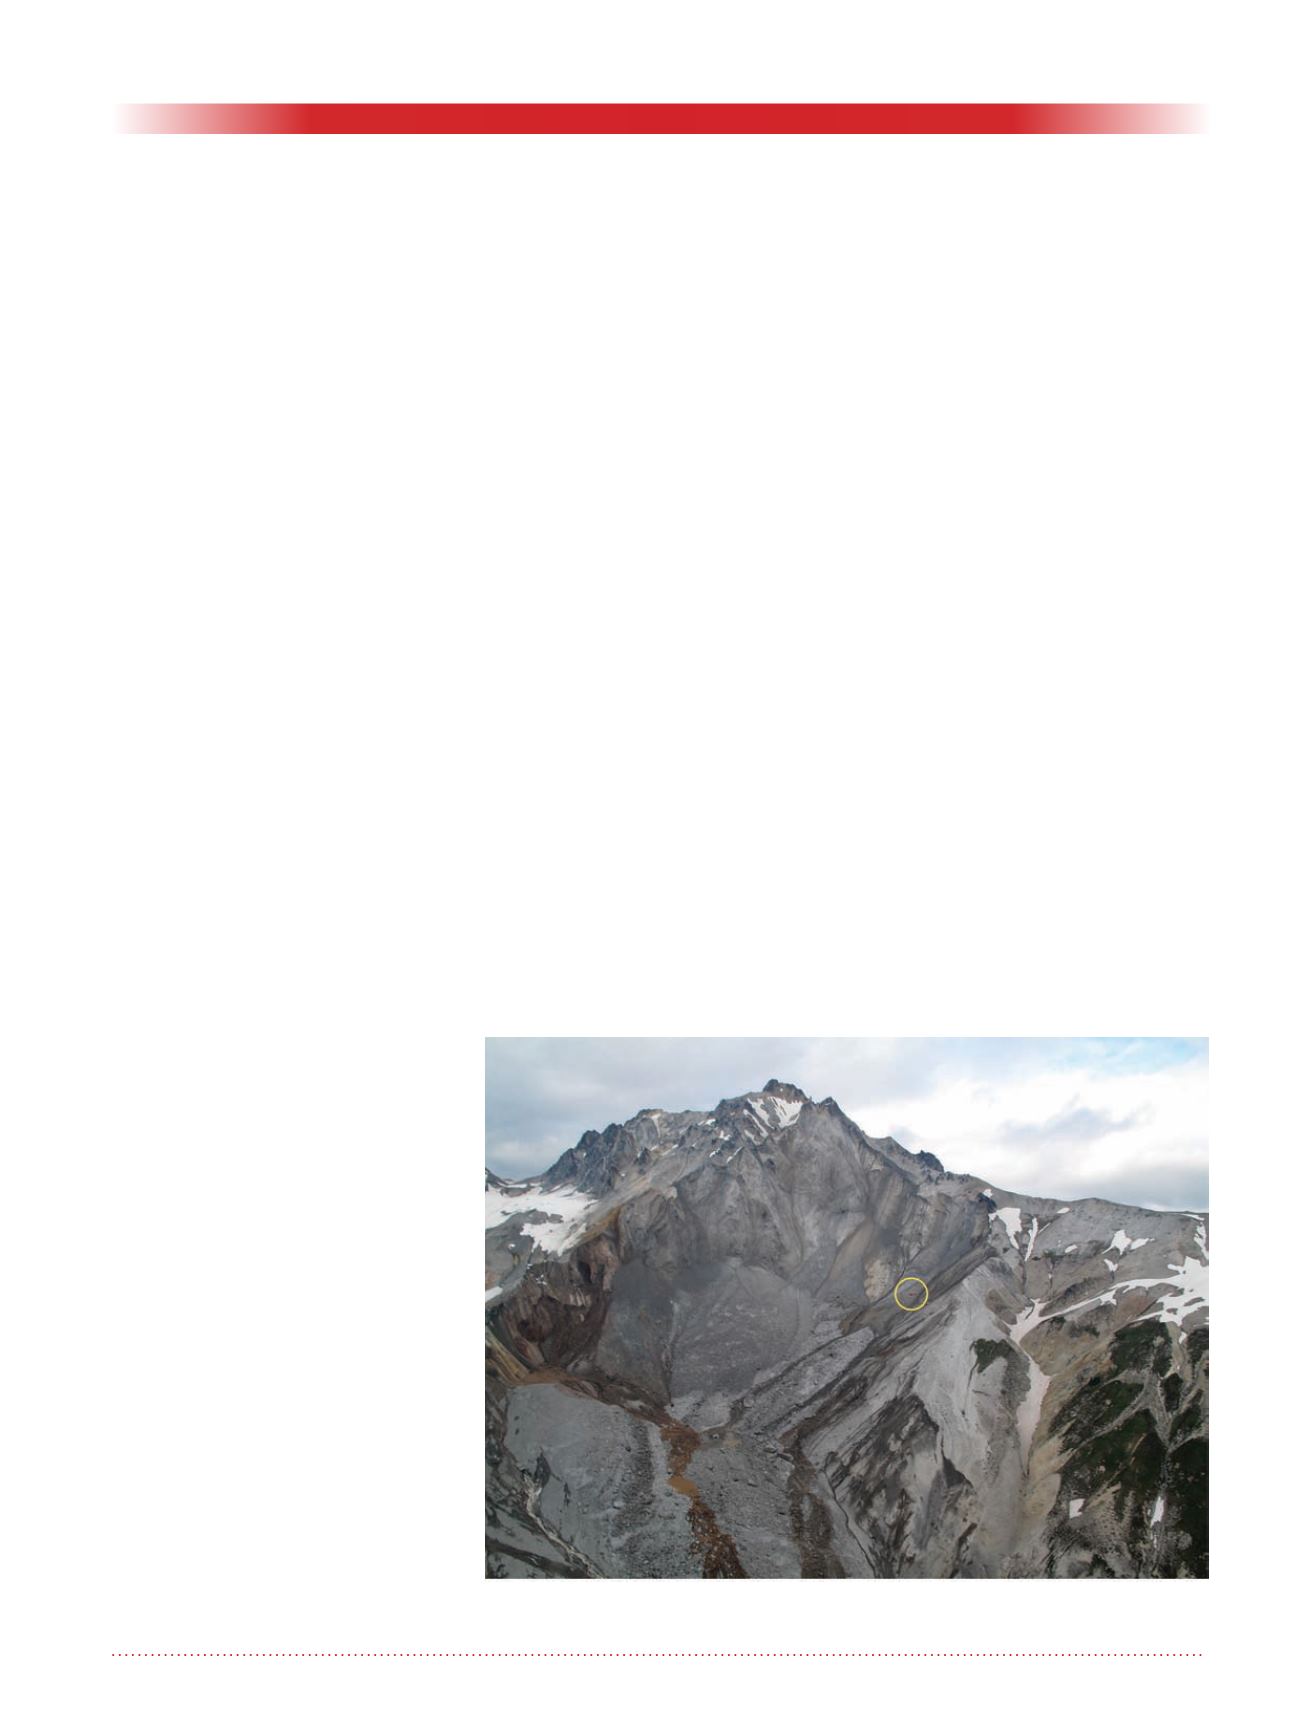
The 2010 Mt Meager landslide
In 2010 the south flank of Mt Meager
(British Columbia, Canada) failed
catastrophically (Figure 1) generat-
ing the largest (~50 Mm3) landslide
in Canadian history (Guthrie et al.,
2012). The collapse evolved as four
structurally controlled sub-failures that
retrogressed from the base of the flank
to the peak of the mountain (Roberti et
al., in press.). The rock mass fractured
forming a rapid debris avalanche that
reached peak velocity of 90 m/s, ran
up to 270 m on the valley sides and
travelled 12.7 km damming Capricorn
Creek for 19 h and partially damming
Lillooet River for 2 h.
SfM-derived base maps were used
for detailed descriptions of the
deposit and revealing the separation
of a water-rich frontal debris flow
and a water-poor, less mobile debris
avalanche core in the landslide event.
The SfM analysis of historical aerial
photos over Meager Peak allowed
the description of the ongoing slow
deformation on the flank responding to
glacier pulsations at its base. We cal-
culated the volume of the collapse and
the geometry of the sub-failures by
Figure 1. Photograph of the main collapse of Mt Meager. Note helicopter for
scale (photograph courtesy of R. Guthrie).


