Geotechnical News • June 2019
33
GEOHAZARDS
consisted of a digital map which was
subdivided in five classes, from very
low to very high, where very high
indicates a combination of terrain
parameters that are typically found
in rock glaciers that show potential
destabilization (Figure 3). Overall, a
significant percentage of undisturbed
rock glaciers was found to be highly
susceptible to destabilization.
Contributions to stakeholders
Although this study provided some
useful tools for local authorities deal-
ing with natural hazards (Figure 3),
uncertainties intrinsic to the method
must be considered. The destabiliza-
tion rating was subjective and many
landforms were difficult to interpret.
The susceptibility map relies on
the hypothesis that the destabiliza-
tion occurrence will increase in the
future (Delaloye and Morand, 2011),
which is still uncertain given the
current state of the art. Indeed, the
destabilization process itself involves
several unknown issues that research-
ers are still far from understanding.
Stakeholders should understand these
uncertainties and not interpret these
tools as a complete description of the
phenomenon. Destabilization rating
and susceptibility maps should be
used as decision-support tool to define
monitoring priorities and strategies.
Where there is a connection between
the occurrence of a rock glacier and
human vulnerabilities, potentially
destabilized landforms should undergo
a detailed survey for precise assess-
ment, while undisturbed landforms
presenting high susceptibility may be
monitored using an approach such as
remote sensing.
Conclusions
This study was developed in the
context of a periglacial risk assess-
ment where the critical factor was
the topographic connection between
landforms and an element at risk
(Kummert and Delaloye, 2018). Given
that, or indeed in the framework of
hazard assessment, the characteriza-
tion of the destabilization phenomenon
is an important step towards a com-
prehensive understanding of evolving
periglacial hazard wherein these land-
forms can potentially mobilize large
volumes of debris. In this context, the
presented methodology allows the user
to obtain a regional scale overview of
the destabilization occurrence using
limited resources and producing useful
tools to prioritize next efforts.
References
Bodin, X., Krysiecki, J. M.,
Schoeneich, P., Le Roux, O.,
Lorier, L., Echelard, T.,
Walpersdorf, A. (2016). The 2006
Collapse of the Bérard Rock
Glacier (Southern French Alps).
Permafrost and Periglacial
Processes, 28(1), 209–223.
Delaloye, R., & Morard, S. (2011).
Le glacier rocheux déstabilisé du
Petit-Vélan (Val d ’ Entremont,
Valais ) : morphologie de surface
, vitesses de déplacement et struc-
ture interne. La
Géomorphologie Alpine: Entre
Patimoine et Contrainte.
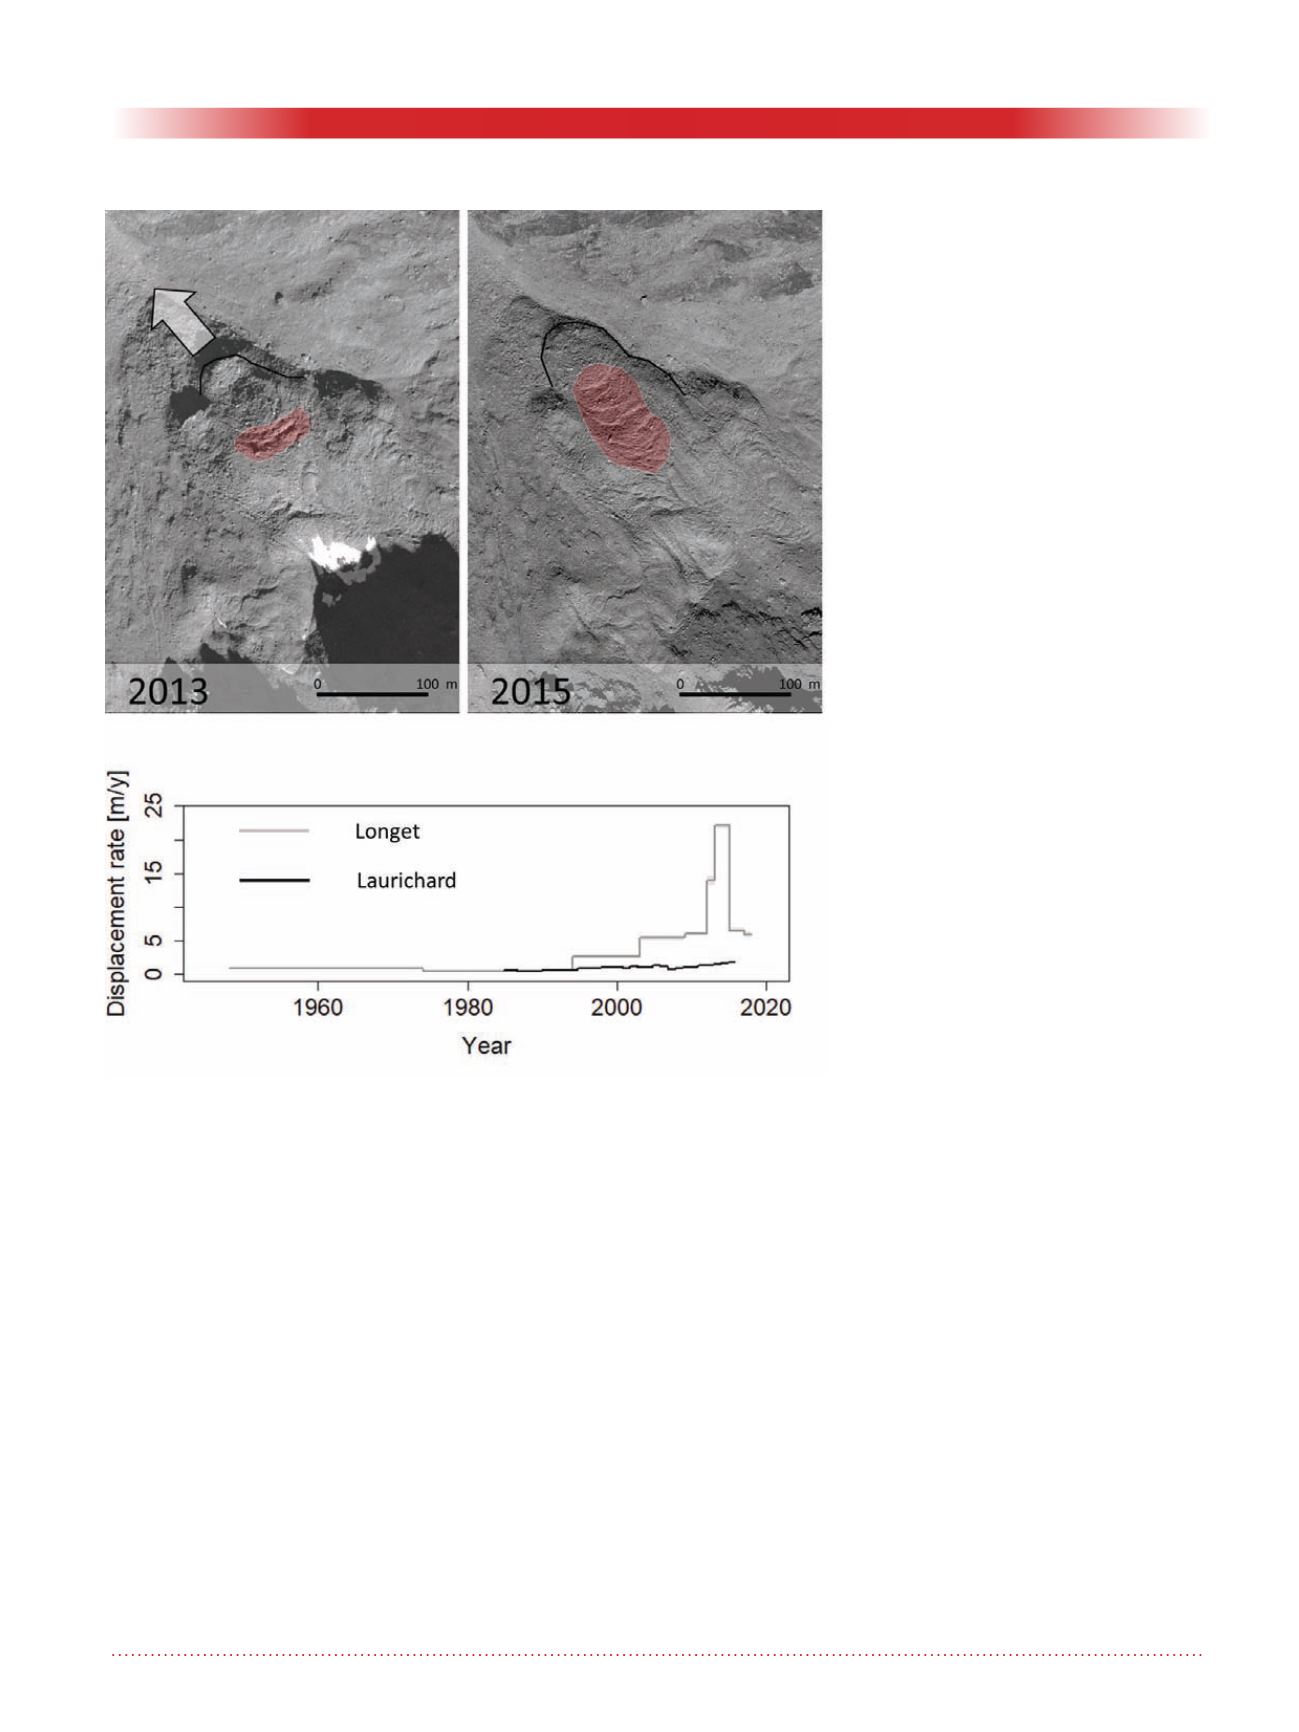
Figure 2: Orthoimages showing the rapid destabilization phase of the Longet
rock glacier (location: 44.660, 6.908) between 2013 and 2015. On bottom
is a graph of displacement rates since the 50s, in comparison to the Laurich-
ard rock glacier (location: 45.017, 6.399), a reference site for displacement
rate monitoring of undisturbed rock glacier in the region.


