Geotechnical News • September 2019
25
GEO-INTEREST
The centrifugal vibrations emanating
from the poker generate water pressure
escalation in the surrounding ground
as they dissipate their energy; this
excess pore water pressure
[
epwp
],
diminishes with distance as does the
amplitude of the vibrations.
What we learn from the craters at
Black Dome is the limiting radius at
which the lateral strains caused by
the
PM
’s vibrations, at the particular
frequency used there, were still just
enough to result in structural collapse
into a denser soil structure. The
epwp
on both sides of the perimeter of these
holes is the same, and is the highest in
the vicinity of the
PM
. So this radius
demarcates the divide between pore
water flowing in opposite directions,
something that seemed paradoxical
before now. At one and the same time
the
epwp
with respect to the draw-
down pressure within the poker causes
flow towards the poker, and yet has
the required differential with respect
to the pond’s hydrostatic head to cause
flow away from the poker.
From seismology we know that higher
frequencies attenuate more quickly
with distance than do low frequencies,
while from mechanics we know that
eccentric weights generate centrifugal
forces which increase with the square
of the rotation rate; the downside of
high frequencies is that they don’t
travel far. So in the case of the PM
interacting with a particular soil type
there will always be an optimal drive
shaft speed. Therefore, field trials are
necessary to find out the best fre-
quency for that material type by trying
out a few different drive rod speed at
separate spots.
Myra Falls very fine tailings
The tailings in the pond at
the Myra Falls zinc and cop-
per mine on Vancouver Island turned
out to be a very fine tailings com-
prised of silts with up to 30% clay
sizes (slimes). Nevertheless a large
surface depression developed in the
area of treatment while the work was
in progress, the true magnitude of
which was masked by the presence of
a geotextile mat within the test pad fill.
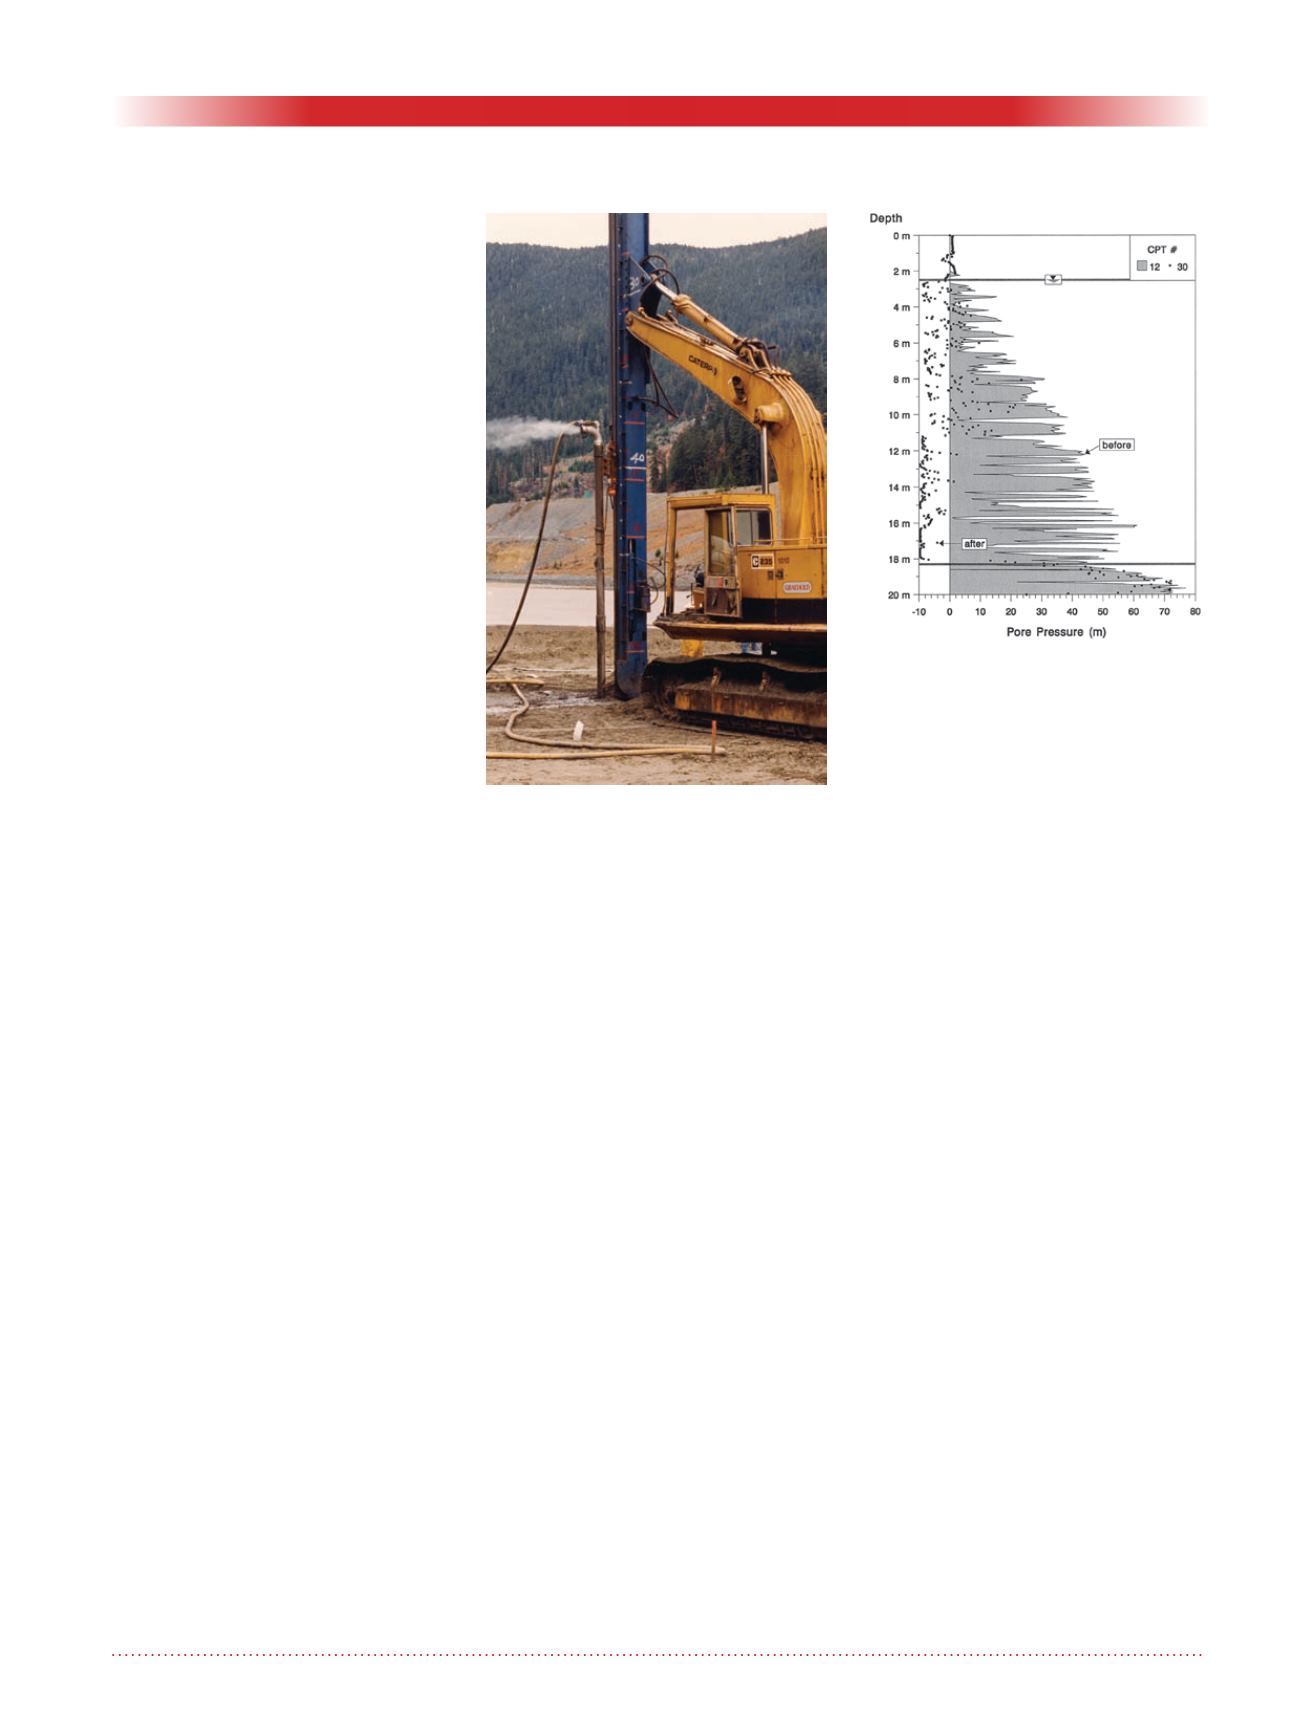
Because of the low permeability of
the tailings there was very little pore
water discharge as can be seen in Fig
5. Fig 6 shows the data comparison
between the CPT’s Dynamic Pore
Pressure Response [
DPPR
] readings
taken in probe#12 “before” treatment
with probe#30 taken “after”
PM
treat-
ment. The credibility of the data is
attested to by the fact that the “before”
and “after” data coalesces below the
treatment depth.
The upper boundary of the
DPPR
trace for the “before” case shows a
response which is about 80% higher
than that which could be attained by
the full depth of the tailings collaps-
ing into suspension; the surplus can
be attributed to energy transfer from
the deformation of the solid phase.
The most extraordinary data is that
from below the 11m depth in probe
#30: The black dots show the
DPPR
values recorded after treatment. These
are virtually all in the negative range,
and mostly very close to the absolute
limit of negative pore water pressure,
that is, full vacuum (minus 10.3m).
Negative pressures are triggered when
the demand for water inflow cannot be
supplied by seepage flow from the sur-
rounding ground at the rate the tailings
wants to dilate.
There can be no doubt whatever that
the tailings in its untreated condition
was liquefiable, but it is manifestly
impossible for a mass in its highly
dilative post-treatment state to liquefy:
Liquefaction requires the soil structure
to collapse into a suspension which
can flow as a fluid. In short, the treated
slimes could have safely supported an
upstream lift.
So how did this great change in
consistency come about? I believe
it is simply this: Typical tailings
deposit, like deltas, consists of loose
inter-layered seams of uniformly sized
particles.
It is therefore only a matter of dis-
turbing this metastable soil structure
enough to cause the individual seams
to become mixed into a far denser
aggregation. The
PM
, with its adhered
seepage mass, created enough local
commotion/agitation to do that.
And that brings us to where we are
now . . .
Figure 5: Myra Falls showing water
discharge haze.
Figure 6: Myra Falls dilatancy
results.


