36
Geotechnical News March 2011
GEOTECHNICAL INSTRUMENTATION NEWS
MultiLogger Suite Web-based Data
Management
Alex Neuwirt, Canary Systems, Inc.
MultiLogger Software
We've been hard at work for over 13
years now to develop software tools to
help our customers in the Geotechnical
Engineering discipline manage their
collection systems and data. Our
software can be described as a “hybrid”
system, it consists of Windows
®
based
workstation tools for automatically
collecting data, populating a SQL
database, configuring the project
interface including notifications and
outputs, and a web component for
viewing the project including alarm
status, creating any of the numerous
outputs or data presentations, and
entering data from the field.
Data Import
Data can be imported automatically or
manually from virtually any source,
either through the built-in automation
(which includes automated program
generation) for Campbell Scientific
controllers, use of “import folders”
for data from other data collectors or
manual data entry. Data are validated
based on tolerance criteria, this helps
avoid alarms based on incorrectly
collected or entered data.
Alarms
Four basic types of alarms are
supported, calculations to include one
or more data or calculated elements
can also be configured with alarms for
virtually unlimited alarm configuration.
For example, the calculation engine
includes aggregate and historical
functions to reduce data and alarm
based on time periods or other criteria.
Notifications
Five types of notifications are
supported, alarms being just one type.
Other notifications include scheduling
electronic delivery of outputs, when
new data are available, when specific
data elements miss their update interval
and when a specific group of data
elements miss their update interval.
Outputs
Eight types of data outputs for data or
calculations are supported including;
Quick Report (columnar reports),
Quick Chart (time series charting),
Spreadsheet (Excel
®
worksheets),
Instrument
Report
(statistical
reporting), Element Chart (series
of multiple elements, e.g. in-place
inclinometer), Wind Rose (wind speed
and direction), Event Chart (event
data captures, e.g. seismic data) and
Inclinometer (standard inclinometer
surveys). Each output can be
extensively configured.
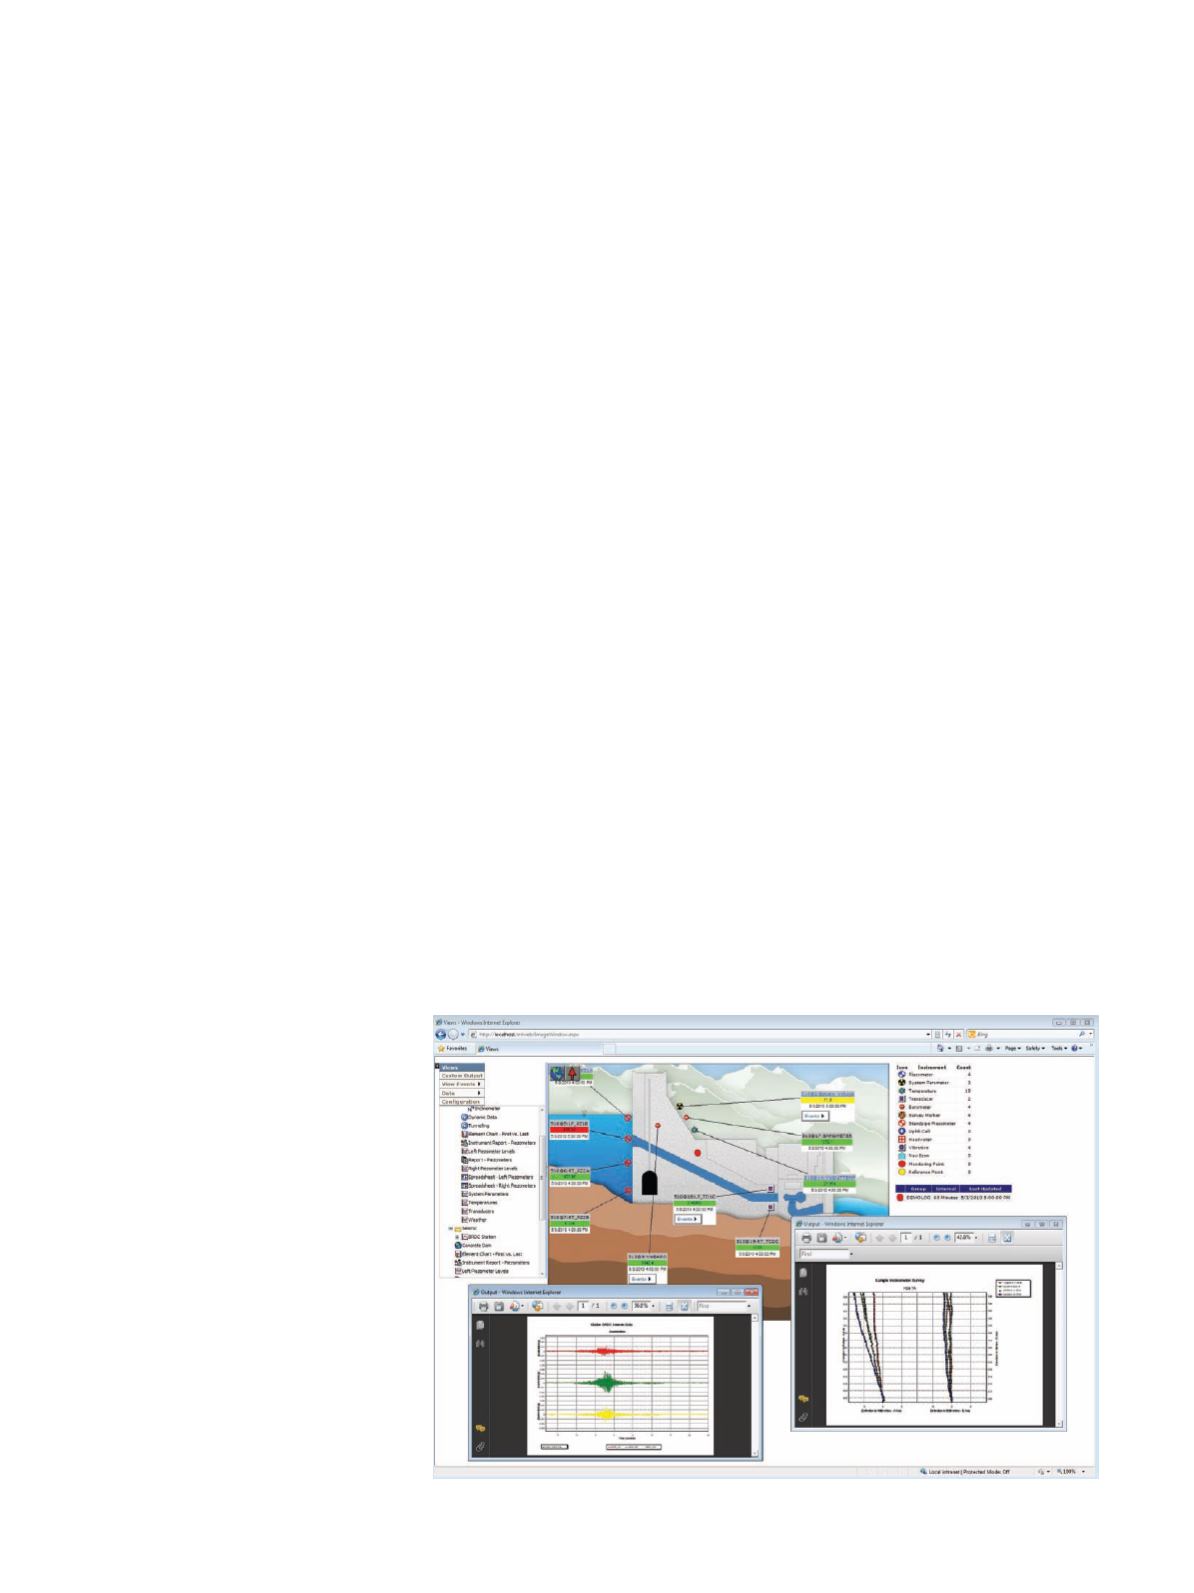
Integrated Web Interface
All of these features are integrated
into an intuitive password-protected
user interface built on the idea of
graphic views of your project and
interactive icon placement based on
location of instruments. Documents
can even be saved into the database
and associated with instrument icons
to provide for storing information such
as calibrations, installation photos or
other reference materials associated
with the instrumentation. This interface
has proven to be an efficient and easy-
to-use interface for experts and novices
alike.
Summary
We’ve worked hard to integrate all
aspects of geotechnical data collection
(whether automated or manual systems)
and management into a single, easy-to-
use, yet powerful software system with
Web interface. This allows personnel
responsible for data management and
reporting of their projects to focus their
time and energy on the information
that the instrumentation is intended to
provide, not on managing the hardware
and software systems. Ultimately this
provides for maximizing the value
of the instrumentation program and
hopefully providing a safer and more
meaningful work environment, and
thanks to the Internet, one that is
always close at hand!
Alex Neuwirt, President,
Canary Systems, Inc.,
75 Newport Road, Suite 201,
New London, NH 03257 USA,
Phone: (603) 526-9800,
email:
Figure 1. Sample project view with event and inclinometer outputs shown.


