38
Geotechnical News March 2011
GEOTECHNICAL INSTRUMENTATION NEWS
Web-based Data Management Software
Andres Thorarinsson, Vista Data Vision (VDV)
VDV is a comprehensive data handling
software for geotechnical projects of
any size. Includes data visualization,
alarming,
real-time
displaying,
reporting and web access to all data.
Run VDV on your own PC for Internal
Data Service, and as a Web Service for
your staff and clients. VDV has been
developed and used since 1991. New
VDV version 2011 in Q2.
Data loggers supported:
Camp-
bell’s Scientific Data Loggers, Geo-
kon’s Data Loggers (both via Logger-
Net or MultiLogger), other data logger
via VDV’s File Converter and vendor’s
Call Engine. Supports Total Stations.
Largest system known: 250 data log-
gers and 5k tags.
Response time: 1-2
second average response time to PC
Query or Web Query.
Data Interface
: Display data
as
Time series, Displacement graphs,
Rate-of-Change, XY-Graphs, Intensity
Plots, Histogram, Data Table, “Wind”
Rose for any data. Combine data from
several locations into single overview.
Easy-to-use interface, choose pen
colors, thickness, background color,
auto and manual Y-scales, linear or log
time axis.
Data Handling:
Built-in fully li-
censed MySQL data base capable of
storing years of data from hundreds
of projects. Alarms in 4 levels with
sound/color/email. Validation. Virtual
Variables for calculated results. Ex-
port of data for Excel. Run your own
SQL queries. Reports with tables and
graphs. Very fast response time unaf-
fected by size of Data Base.
Web Service:
VDV is ready to
run Web Service right out of the box,
no programming, only needs fixed IP
number from a Service Provider. Use
VDV as SCADA monitoring and/or as
a research tool. Customize web lay-
out. Navigate all graphs. Acknowledge
Alarms. Write Notes about sensors and
locations. Add Web Cams and Photos
to any Project. Manual Input of data.
Modify data. Support to Smart phones.
Choose language of web service.
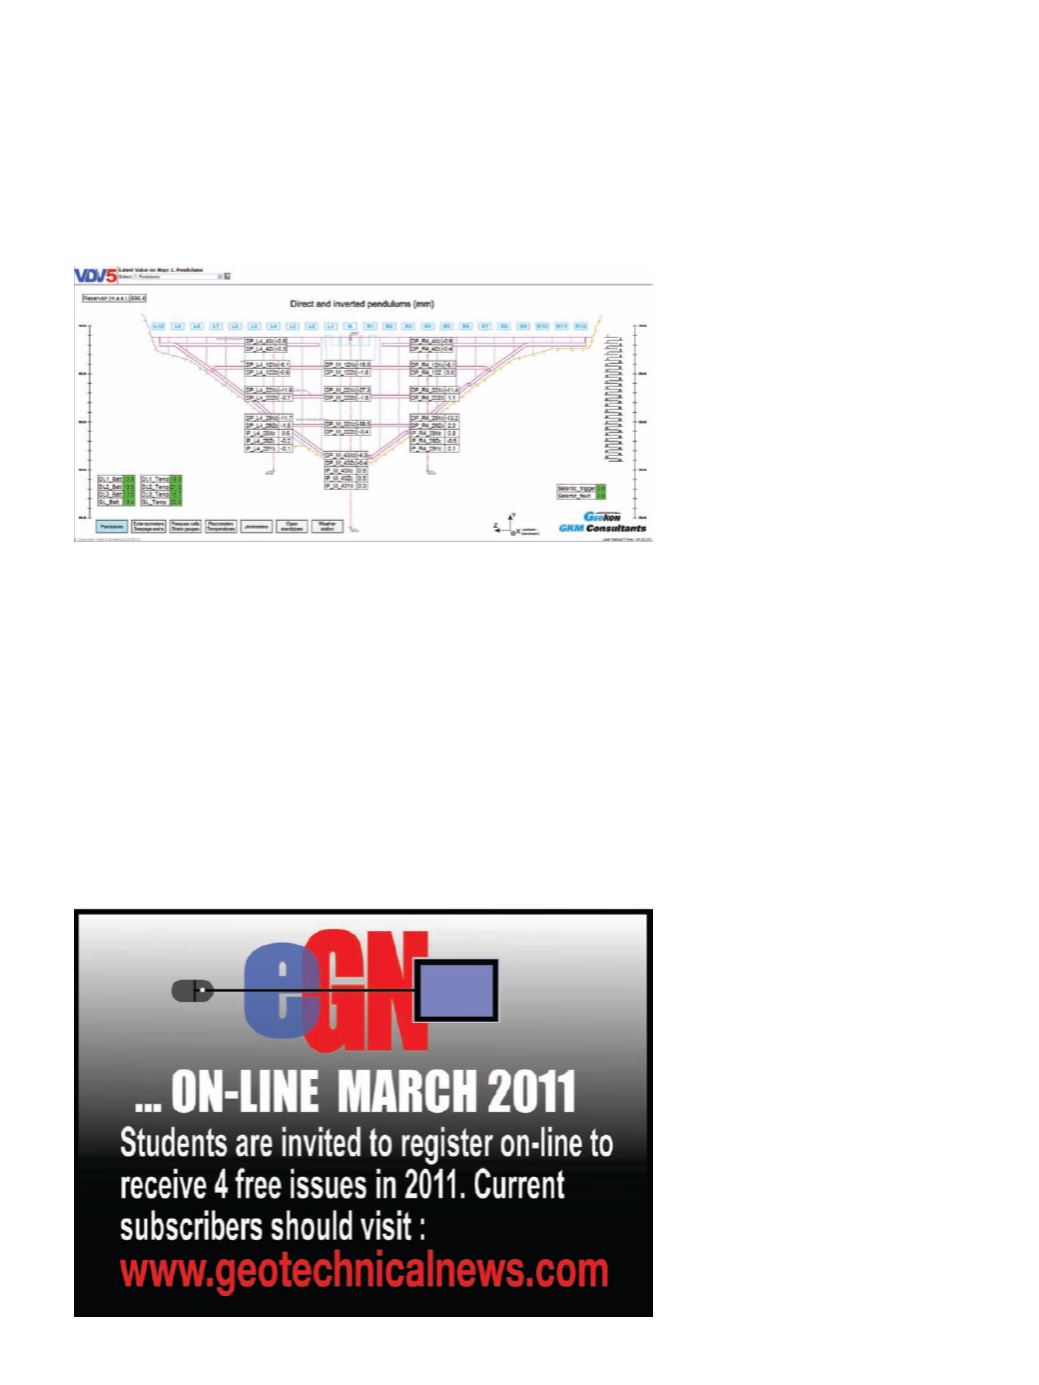
Real-time Handling:
See latest
data on maps in layers with navigation
buttons and any picture or artwork as
background. Display data as number,
cluster of numbers or graphs. Show
alarm status by background color. Sup-
port Google maps. Easy-to-use inter-
face.
Download fully working version of
VDV or participate in web-seminar to
learn more.
References:
Seattle Department of
Transportation, USA; Tsankov Kamak
Dam, Bulgaria; Linha 4 Metro, Brazil;
US Army Corps of Engineers, USA,
Ingula Pump Station/Dam project,
South Africa; Desert Research Insti-
tute, USA.
Andres Thorarinsson,
CEO of Vista Engineering and
Vista Data Vision,
,


