Geotechnical News June 2011
27
GEOTECHNICAL INSTRUMENTATION NEWS
several adjacent pixels over large ar-
eas. In other words, TInSAR images
can be seen as a very dense network of
adjacent sensors (i.e. pixels) collecting
data simultaneously over a large area.
The main practical advantages of this
feature are:
• increasing the statistical reliabil-
ity of monitored displacements be-
cause data are collected in several
adjacent pixels
• monitoring of large areas, thus
avoiding the risk of underestimat-
ing the size of the displacement
area
• identification of spatial distribution
and gradient of displacement.
Additional features such as the high
data sampling rate (few minutes),
long range efficacy (up to some
kilometers) and the high accuracy in
the displacement measurement make
this technique a valuable monitoring
solution for appropriate geotechnical
problems.
However, in spite of its advantages,
this technique is characterized by some
limitations which must be taken into
account. The difficulties in the manage-
ment, processing and interpretation of
data are probably the main limitations.
Mistakes can be made if the technique
is not used in the appropriate way and
if data are not analyzed carefully. Some
additional limitations related to techni-
cal features are:
• the large size of commercial equip-
ment, having a rail of at least a cou-
ple of meters long
• the cone of view is limited to a few
tenths of degrees (depending on an-
tennas) in the horizontal and verti-
cal planes
• the displacement can be measured
only along the line-of-sight direc-
tion, i.e., the displacement moni-
tored by TInSAR is only a compo-
nent of the real displacement
• phase ambiguity, i.e. the displace-
ment between two subsequent im-
ages can be measured without am-
biguity only if the phase difference
is lower than π/2 (about 4.5 mm for
the typical signal frequency used
by the Terrestrial SAR Interferom-
eters).
However, the above mentioned
limitations can be reduced by a careful
monitoring planning (in terms of the
installation site and the monitoring
plan). For example, in order to
optimize the displacement detection
capabilities the equipment can be
installed as parallel as possible to
the real displacement direction. The
phase ambiguity can be solved (up to
a threshold velocity on the order of
meters/day) by a high data sampling
rate.
Comparison with Conventional
Techniques
The first comparison of TInSAR should
be with Satellite SAR Interferometry
(SInSAR), since they are based on the
same operational principle. However,
due to the different platforms (ground-
based and satellite-based respectively)
there are several differences between
them, especially in terms of achievable
results. SInSAR is a suitable technique
for monitoring large areas characterized
by slow movement (e.g. subsidence,
volcanic structures, unstable regions
etc.), while TInSAR is more suitable for
the detailed and continuous monitoring
of small areas, up to few square kms,
that are characterized by both slow and
rapid movement (e.g. single unstable
slopes and cliffs, volcanic flanks etc).
Also, due to the low data sampling
rate (about one image per month),
SInSAR is not suitable for control and
continuous emergency monitoring, but
is more appropriate as an investigation
tool (especially if the historical
database of satellite images available
from 1992 is considered). In contrast,
TInSAR images can be collected only
after the installation of equipment.
The comparison of TInSAR with
robotic total stations (RTS) is probably
more appropriate because these tech-
niques are often used for similar appli-
cations, even though they are based on
different operating principles. In what
follows a brief comparison between
these two techniques is given. First
of all, RTS is based on Laser technol-
ogy, while TInSAR is based on Radar
technology; i.e. RTS uses Light or
Infra-Red waves while TInSAR uses
Microwaves. From the practical point
of view the main difference is related
to the monitoring effectiveness of
TInSAR with the presence of fog and
clouds (not acceptable for RTS). Fur-
thermore, RTS requires the installation
of targets in the monitored area while
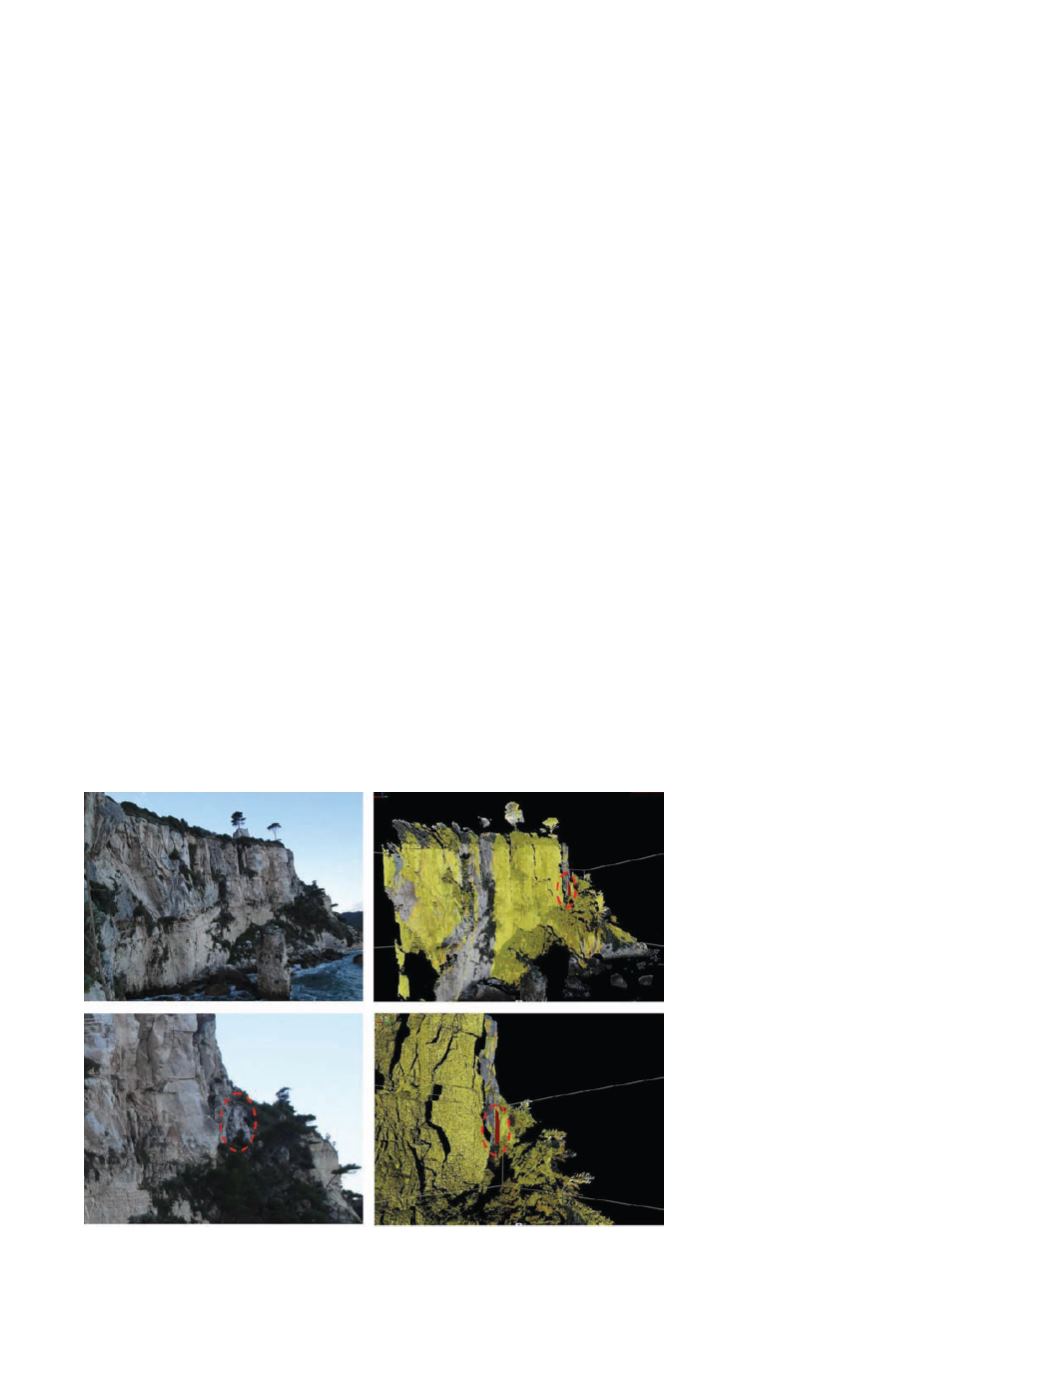
Figure 3. Picture of a costal rock cliff in the southern part of Italy (on the left). On
the right, 3D displacement images achieved by the combination of TInSAR image
and TLS DTM (Digital Terrain Model); yellow-green color identifies stability while
red color identifies sectors affected by displacements.


