Geotechnical News June 2011
33
COMPUTING IN GEOTECHNICAL ENGINEERING
Automatic Software Detection of CPT
Transition Zones
P.K. Robertson
One of the main advantages of the
Cone Penetration Test (CPT) is the
continuous nature of the test results
that provide excellent profiles of soil
type, detailed stratigraphy, and in-situ
mechanical properties of the ground.
However, for some applications, such
as inter-layered soils, the continuous
nature of CPT results can present
challenges when using CPT-based
software for geotechnical design.
It has long been recognized that al-
though the CPT measures the correct
cone tip resistance (qc) in uniformly
weak or strong materials, the transition
from one layer to another will not nec-
essarily be registered as a sharp change
in qc at the inter-layer boundary. Ex-
perimental studies (Treadwell, 1976)
have shown that the cone tip resistance
is influenced by the material properties
both ahead and behind the penetrat-
ing cone. Hence, the cone will start to
sense a change in material type before
it reaches the new material, and will
continue to sense the previous material
after if it has entered a new material.
Therefore, the CPT may not always
measure the correct tip resistance in the
transition zone from one soil layer to
another, if the soils have strongly dif-
ferent cone values.
Lunne et al. (1997) note that the
distance over which the cone senses an
interface increases with material stiff-
ness. Ahmadi and Robertson (2005) il-
lustrated this using numerical analyses
and confirmed that in strong/stiff soils
the zone of influence is large (up to 15
cone diameters) whereas in soft soils
the zone of influence is rather small
(as small as 1 cone diameter). Figure
1 (after Ahmadi and Robertson, 2005)
illustrates the variation of cone tip re-
sistance from a compilation of several
analyses in which the thickness of a
dense sand layer in a soft clay deposit
is changed. Figure 1 shows that as the
thickness of the sand layer increases,
the tip resistance reaches closer to the
true tip resistance of the sand. For the
set of soil parameters selected in the
analyses (i.e. dense sand in soft clay),
the results shows that the cone can
reach its fully mobilized tip resistance
in the dense sand if the thickness of the
sand layer is equal to or greater than 1.0
m, i.e. about 28 cone diameters. Figure
1 also shows that for the initial part of
the penetration profile in the sand layer,
all tip resistance profiles for different
layer thickness have a common transi-
tion profile. This indicates that the cone
at the beginning of penetration into the
sand layer responds similarly irrespec-
tive of the layer thickness. However, as
the cone penetrates further, it starts to
sense the upcoming new soft clay in-
terface. The thinner the sand layer, the
sooner the cone responds to the soft
clay below and the smaller the maxi-
mum measured cone resistance within
the sand.
The zone of influence ahead and
behind a cone during penetration will
influence the cone resistance at any
interface (boundary) between two soil
types of significantly different strength
and stiffness. Hence, it can be im-
portant to identify the transition zone
between different soils types to avoid
possible misinterpretation. This issue
has become increasingly important
with CPT-based software that provides
interpretation of every data point from
the CPT. When CPT data are collected
at close intervals (typically every 20 to
50mm) several data points are ‘
in tran-
sition’
when the cone passes an inter-
face between two different soil types
(e.g. from sand to clay and visa-versa).
For some geotechnical design prob-
lems, such as pile design, the existence
of transition zones in a CPT profile is
captured in the design methods by ac-
counting for scale effects between the
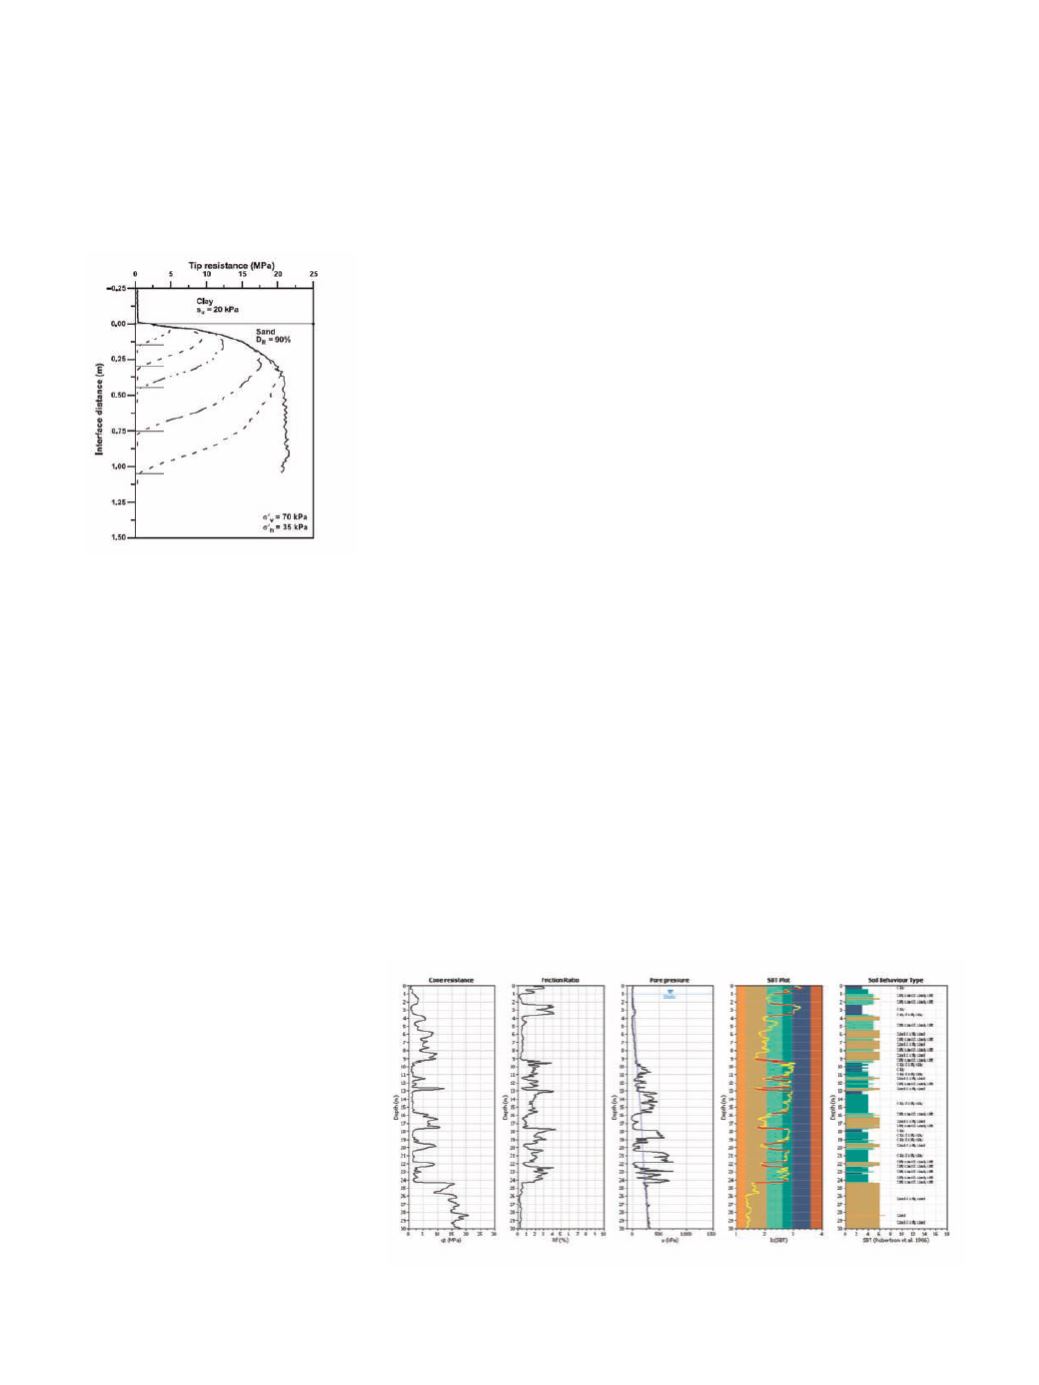
Figure 1. Numerical simulation of
CPT tip resistance for a 10 cm
2
cone in
dense sand layers within soft clay (af-
ter Ahmadi and Robertson, 2005).
Figure 2. Example CPTu profile in inter-layered soils to illustrate transition zones
(indentified in red) on the SBT I
c
profile (4
th
column).


