30
Geotechnical News June 2011
GEOTECHNICAL INSTRUMENTATION NEWS
SHMLive Web-based Data Management
Software
Daniele Inaudi, Roctest / SMARTEC
Web-based services are becoming
the new standard in reliable and cost
effective mission-critical business
applications, such as email, customer
relationship management tools or
document exchange. In the same way
that it makes sense to operate your own
power generation station in house, the
management and
publication
of
monitoring data
is more efficiently
managed
by
instrumentation
and
IT
p r o f e s s i on a l s ,
rather than civil
or geotechnical
engineers
or
owners.
The
SHM-
Live web portal
is a secure hosted
website coupled
with an online
database
that
manages and dis-
plays monitoring
data in real-time
anywhere in the
world. SHMLive
web portal is a
part of Roctest’s
complete SHM-
Live
offering,
which can also in-
clude full moni-
toring services,
such as design,
installation and
all hardware, pro-
vided for a fixed
monthly fee.
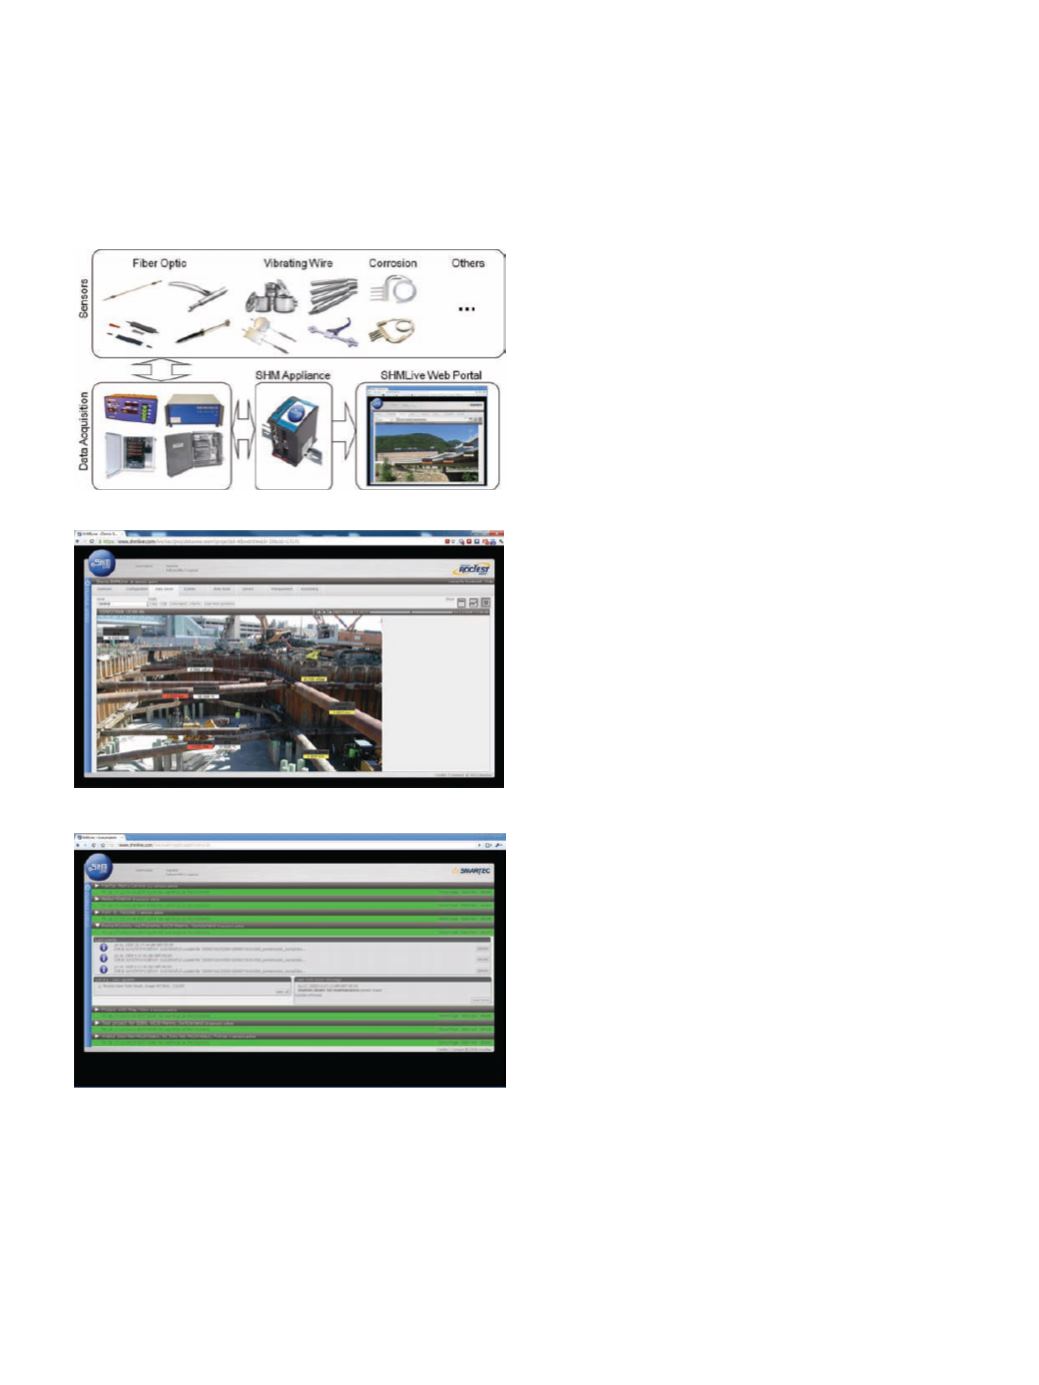
The
SHM-
Live
database
can receive data
from a large va-
riety of measure-
ment
systems
and sensors such
as vibrating wire
instruments, fiber optic sensors, laser
sensors, concrete corrosion sensors,
and any type of electrical sensors. As
depicted in Figure 1, data is automati-
cally pushed to the SHMLive database
from our SHM Appliance, which col-
lects the data directly from all installed
data acquisition systems, without the
use of text files or other intermediate
data formats. All data is stored in our
secure and redundant database system,
located in a data center with the highest
standards of reliability and security.
Authorized users gain access to their
data through an easy to use online web
portal where data is available 24/7 for
display and downloading to Excel and
other formats. The web interface allows
different levels of authorization for data
access and users can easily log on with
any web browser or smart phone. The
SHMLive web portal allows real-time
alerting and advanced data representa-
tion, enabling an unlimited number of
data views in table, graph or map plots
(Figure 2) with associated options such
as thresholds plots, X-Y plots and col-
or coding. It is also possible to define
warnings and alerts, based on individu-
al sensors or free mathematical formu-
las, combining the values of multiple
sensors. Alert levels, language of the
user interface and delivery methods,
such as email or text messaging, can be
tailored to individual user preferences.
The Web portal also serves as an
information hub, allowing the storage
of complementary documents, reports,
alert histories and log book entries,
facilitating communication among all
stakeholders within the monitoring
project. A summary page (Figure 3)
allows a quick overview of the status
of all projects to which the user has
access. The web-interface can be re-
branded with the user logo, with links
to any external websites containing
complementary data, such as webcams
or meteorological data.
The SHMLive portal is accessible
at
.
Daniele Inaudi, CTO
SMARTEC / Roctest Group
Via Pobiette 11, 6928 Manno,
Switzerland,
Figure 1. SHMLive System Architecture.
Figure 2. Map data representation example.
Figure 3. SHMLive project summary page.


