34
Geotechnical News June 2011
COMPUTING IN GEOTECHNICAL ENGINEERING
cone and pile size. However, when
estimating geotechnical design param-
eters in inter-layered deposits, the tran-
sition zones at the layer interfaces may
produce misleading variations in esti-
mated parameters. For example, either
the sand close to the boundary with a
soft clay layer may appear loose, or the
clay next to a sand layer may appear
stiff in the transition zone. In a lique-
faction analysis the CPT data within the
thin transition zone (e.g. from a sand
to a clay) can result in a misinterpreta-
tion of soil type that may predict that
the soil in the transition zone has the
potential to liquefy resulting in conser-
vative additional calculated post-earth-
quake deformations. Hence, it can be
helpful if the CPT-based software has
the ability to both indentify and remove
any transition zones to evaluate their
influence on any subsequent analysis.
The following describes how software
can be used to automatically detect and
remove transition zones in CPT data.
Jefferies and Davies (1993) identi-
fied that a Soil Behaviour Type (SBT)
Index,
I
c
, could represent the SBT
zones in the normalized CPT Q
t
- F
r
chart where,
I
c
is essentially the radius
of concentric circles that define the
boundaries of soil type. Robertson and
Wride, (1998) modified the definition
of
I
c
to apply to the Robertson (1990)
Q
t
– F
r
chart, as defined by:
I
c
= [(3.47 - log Q
t
)
2
+ (log F
r
+
1.22)
2
]
0.5
[1]
where:
Normalized
cone
resistance,
Q
t
= (q
t
– σ
vo
)/σ’
vo
Normalized
friction
ratio,
F
r
= [(f
s
/(q
t
– σ
vo
)] 100%
q
t
= CPT corrected cone resistance
f
s
= CPT sleeve friction
σ
vo
= in-situ total vertical stress
σ’
vo
= in-situ effective vertical stress
Robertson (2010) further modified
equation 1 to apply the
I
c
concept to the
non-normalized SBT chart based on di-
mensionless cone resistance (q
t
/p
a
) and
friction ratio (R
f
).
It is possible to identify the tran-
sition from one soil type to another
using the rate of change of
I
c
. When
the CPT is in transition from sand to
clay the SBT
I
c
will move from low
values in the sand to higher values in
the clay. Robertson and Wride (1998)
suggested that the approximate bound-
ary between sand-like and clay-like
behaviour is around
I
c
= 2.60. Hence,
when the rate of change of
I
c
is rapid
and is crossing the boundary defined by
I
c
= 2.60, the cone is likely in transi-
tion from a sand-like to clay-like soil
or vise-versa. Profiles of
I
c
can provide
a simple means to identify and remove
these transition zones.
To illustrate this approach an ex-
ample CPT profile is shown in Figure
2 that was carried out at a site where
there were numerous inter-layers of
sand and clay. Figure 2 shows the pro-
files of corrected cone resistance (q
t
),
friction ratio (R
f
), measured pore pres-
sure (u
2
), SBT index
I
c
,
and the SBT
based on the non-normalized charts by
Robertson et al., (1986) and updated
by Robertson (2010). The clay/silty
clay layers (where
I
c
> 2.60) are clearly
identified on the continuous profile
of SBT
I
c
. The SBT zones are colour
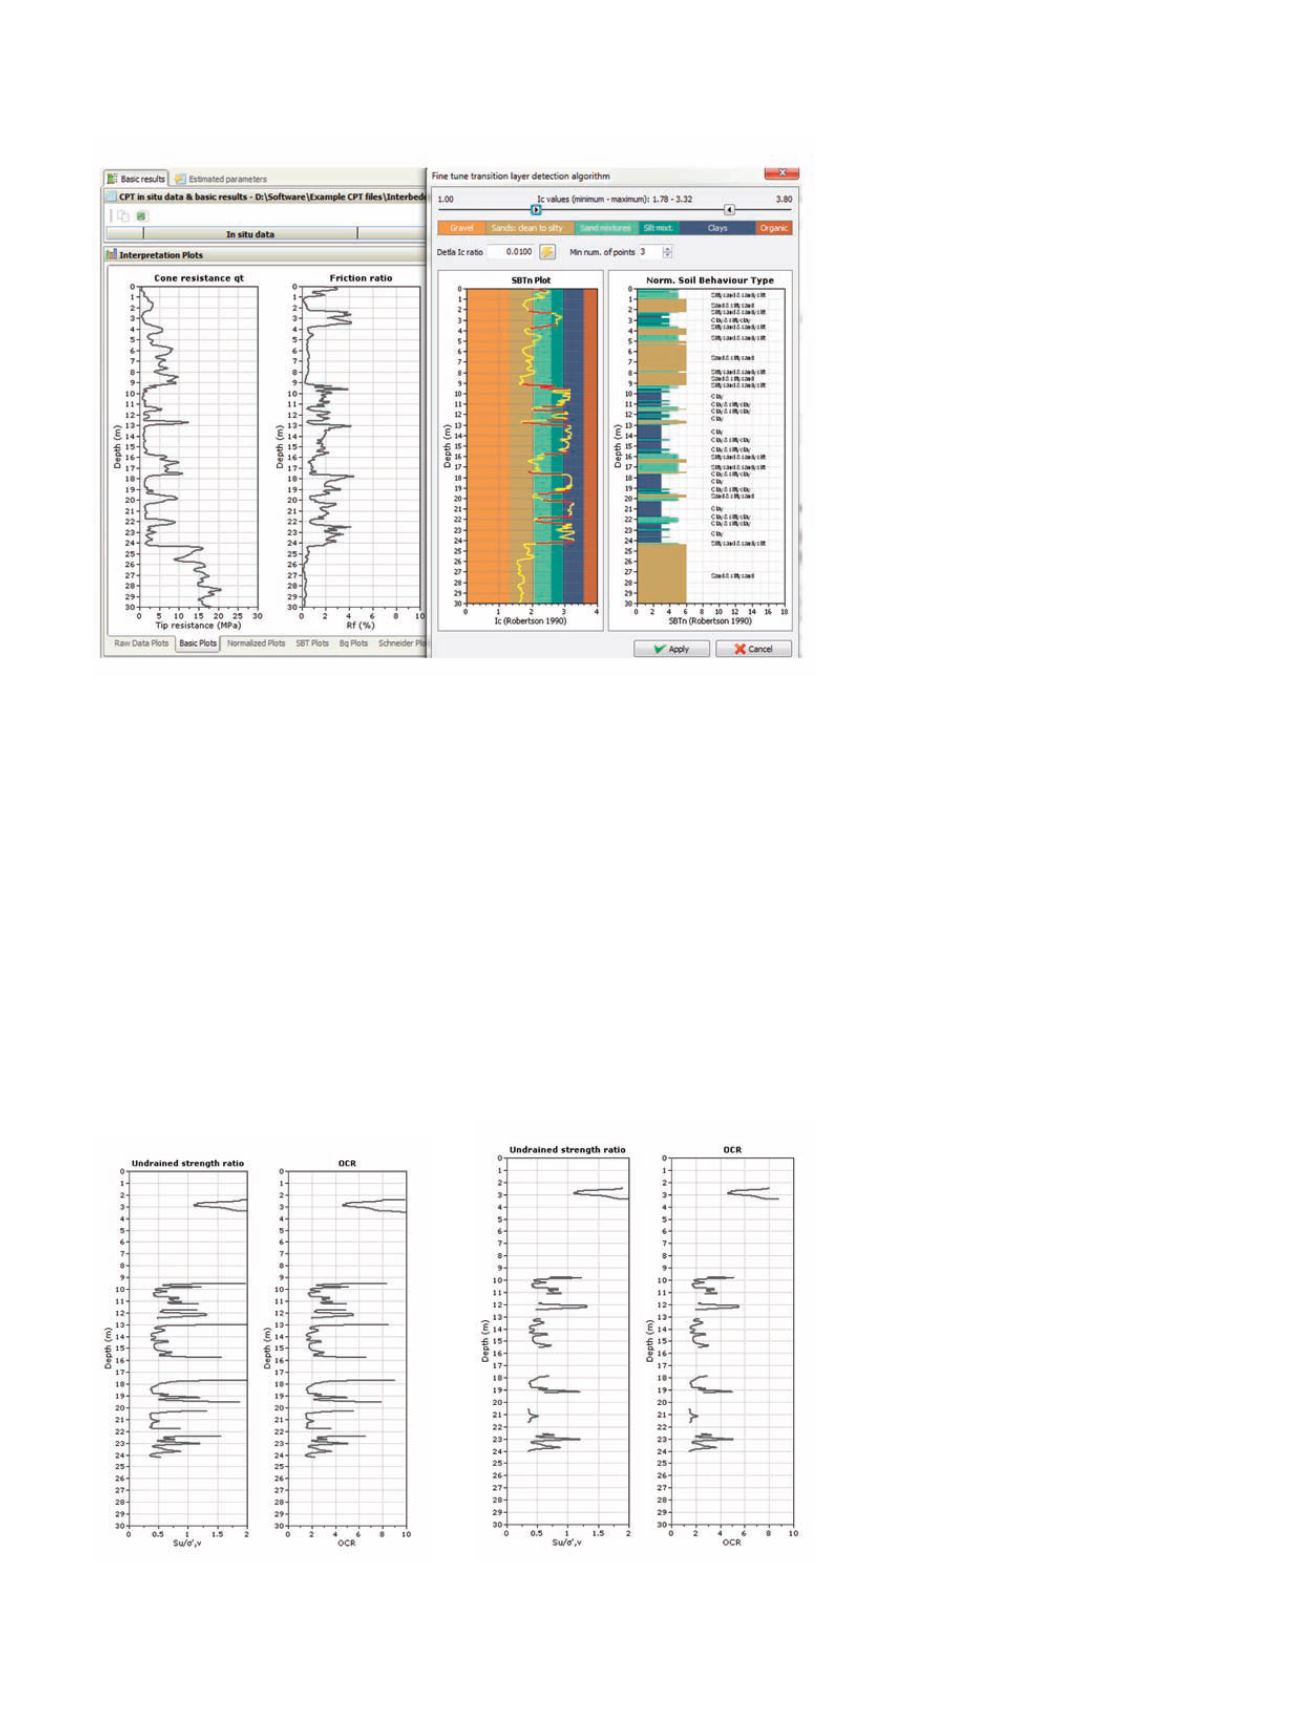
Figure 3. Transition layer detection dialog box used in CPeT-IT for the example
CPTu.
Figure 4. Example CPTu profile showing estimated undrained shear strength ratio
(s
u
/σ’
vo
) and OCR (a) with transition zones, and (b) with transitions zones removed.


