Geotechnical News June 2011
31
GEOTECHNICAL INSTRUMENTATION NEWS
Atlas Web-Based Data Management
Software for Instrumentation
Rick Monroe, Durham Geo Slope Indicator
Atlas - the Project Web Site
Think of Atlas as a web site that is
dedicated to a project. The pages of
the web site include plan views and
photographs of the project and contain
links to data, graphs, and reports. Users
log into Atlas with their web browsers.
Atlas provides three levels of ac-
cess. “Administrators” can create new
projects, authorize users, and set up
sensors, graphs, plan views, alarms,
and reports. “Users” can see graphs
and plan views, enter manually-collect-
ed readings, and add notes and photos
to the logbook. “Guests” can see only
selected plan views and plots.
Data Collection
Atlas provides web forms to receive
manually-collected readings, a log-
book to receive notes and photos, and
an input folder to receive data files
forwarded from data loggers.
Atlas processes incoming data to
check for alarm conditions, but it stores
only the original, unprocessed readings
in its database. Thus readings in the
database remain directly traceable to
readings collected at the site.
Data Processing
When Atlas generates a graph or
serves data, it always processes the
original readings on the fly. This makes
calculations easy to verify, and it
ensures that changes or corrections to
calculations take effect immediately,
with no need to purge and rebuild the
database with corrected readings.
The core of the Atlas processing
engine is the sensor table. It lists ev-
ery sensor along with its calibration
factors, unit conversions and labels,
alarm limits, and processing instruc-
tions. Processing instructions accept
most math functions and can reference
earlier readings and other sensors. This
makes it possible to calculate changes,
correct for temperature and baromet-
ric pressure, and perform cumulative
calculations for in-place inclinometers
and beam sensors.
Data Presentation
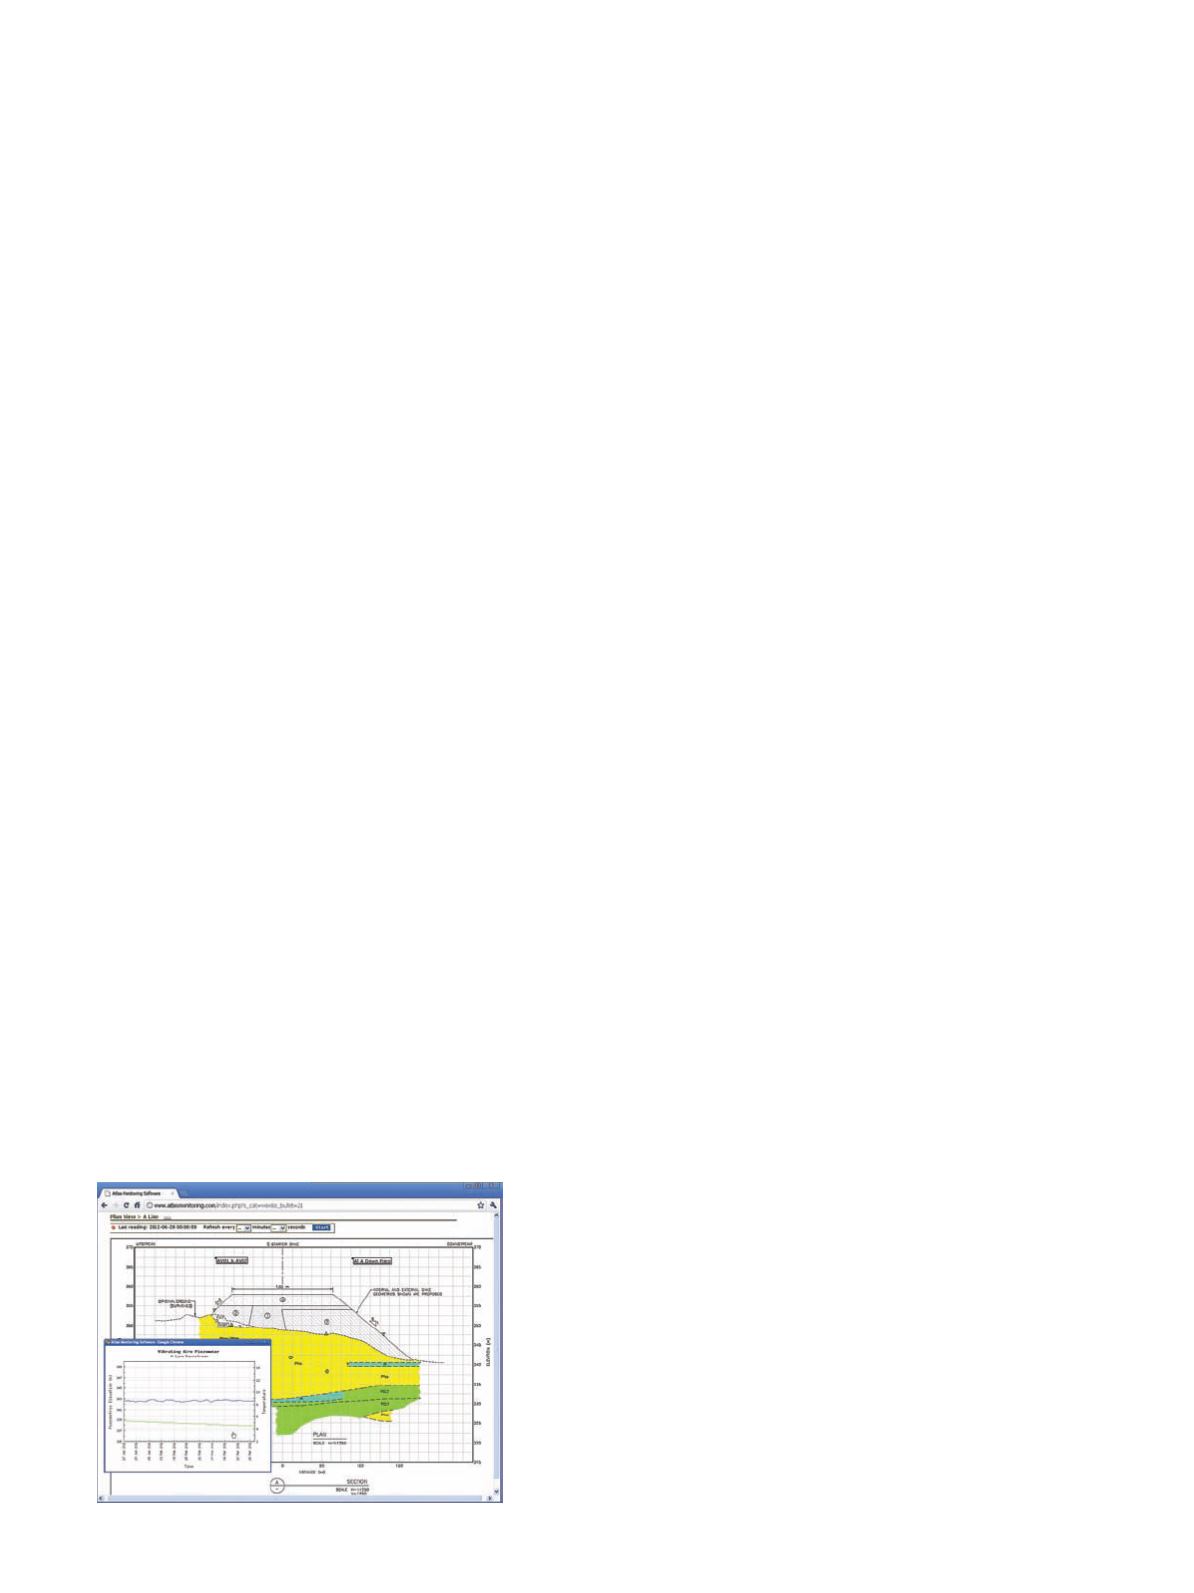
Plan views are site drawings or
photographs that show the location,
current reading, and alarm status of
all the sensors at a site. Sensors are
represented as icons that change color
to indicate their alarm status: green
for normal, yellow or red for alarms.
Mousing over an icon displays the
current reading, and clicking on a
reading calls up a trend plot. A quick
look at the trend plot can reveal whether
the alarm condition is the result of a
trend or a transient event.
Plots present data graphically and
automatically include the most recent
readings. Atlas provides trend plots, pro-
file plots, and correlation plots. Multiple
Y scales allow different types
of sensors to be shown on the
same plot. Clicking the plot
displays a table of the values
used in the plot.
Reports present a daily,
weekly, or monthly com-
pilation of selected plots,
data, log book entries, and
photographs. Reports can be
distributed automatically by
email as PDF attachments.
Alarms and Notifications
When Atlas detects an alarm condition,
it records the alarm in a logbook,
displays an on-screen warning, and
generates an alarm notification. An
alarm notification is an email or sms
message that identifies a sensor, the
time and value of the reading, and the
level of the alarm.
Atlas provides filters that help vali-
date alarms, consolidate notifications,
and delay or escalate notifications.
This filtering improves user confidence
in the alarm system and also prevents
alarm notifications from flooding email
boxes and cell phones.
Data Downloads and Archiving
Readings can be downloaded for
analysis in other programs. After the
user specifies sensors, a date range, and
a data format, Atlas generates a text file
that can be saved on a local PC and
opened in a spreadsheet.
Data can be archived two ways. Ar-
chiving processed readings makes data
available for historical investigations
after completion of the project. Ar-
chiving the original readings provides a
way to control the size of the database,
though this function is rarely needed.
Software Response Time
The overall response time of a
monitoring system is likely to be
controlled by the rate of data collection
rather than by the responsiveness of
the software. That said, Atlas can serve
graphs within one or two seconds,
refresh plan views every few seconds,
and send out alarm notifications seconds
after the arrival of new readings.
Rick Monroe, DGSI,
12123 Harbour Reach Drive,
Mukilteo, WA 98275 USA,
Tel: 425-493-6200,
email


