28
Geotechnical News December 2011
GEOTECHNICAL INSTRUMENTATION NEWS
Applied pressure to the test chamber
was recorded manually and was incre-
mentally adjusted to test the response
time of the VWP to the differing pres-
sures applied at the base of the cham-
ber.
Test Results
With all of the installation methods
in sand or water, the VWP responded
within less than 20 seconds to changes
in pressure, and reliably recorded
pressure, with maximum errors of 3kPa
and a standard deviation less than 0.1
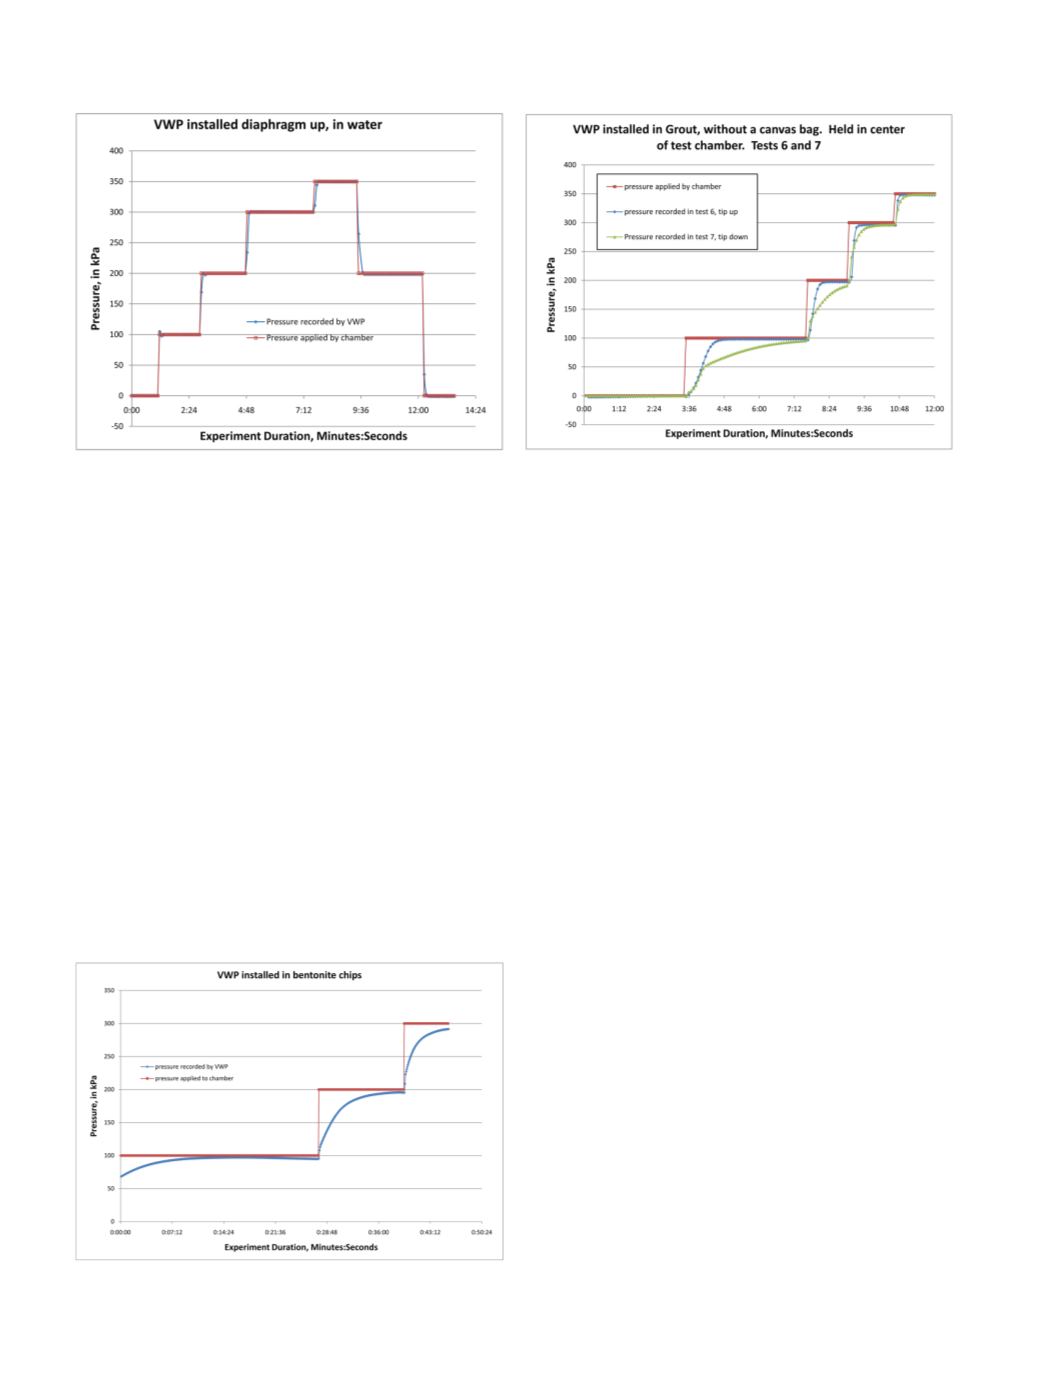
kPa. Figure 2 shows the comparison
between the applied pressure measured
by the triaxial compression test
chamber and that recorded by the VWP
for test 1 a.
This response time and accuracy
was typical for tests 1 (a and b) through
5. It is also important to note, that
for one test, I intentionally captured
as much air as I could with the in the
chamber of the VWP between the filter
stone and the diaphragm, and it func-
tioned with similar response times to
those in Figure 2. It is also important to
note that the VWP installed in a canvas
bag in grout had response times closer
to a VWP installed in sand than a VWP
installed in grout without a bag. How-
ever, the long axis of the bag was al-
most as tall as the cylinder, which min-
imized the distance the water pressure
had to travel, a situation we wouldn’t
see in the field.
Figure 3 is the graph of response
times for test 6 and 7.
As shown in
Figure 3, there
is a larger de-
lay between the
pressure applied
by the frame
and the pressure
measured
by
the VWP for the
instruments in-
stalled in grout. I
suspect that this
is due to the in-
complete satura-
tion of the grout.
If air was present
in the grout, it
would compress
and dissolve into solution when pres-
sure was added, which would delay the
VWP from responding to the effects of
the pressure added to the chamber. This
hypothesis is supported by the fact that
the incremental pressure steps from
100 to 200 kPa has a shorter response
time compared with the intervals from
0 to 100 kPa, potentially because the
air is already partially compressed and
dissolved. In addition, it was observed
that more water had to be added to in-
crease the pressure from 0 to 100 kPa
in the grout than from 100 to 200 kPa.
In general, as the testing sequence pro-
gressed from water to sand to grout
to clay, I observed that progressively
more water was required to increase
the pressure in the chamber. Assuming
that the VWP would be installed below
the water table in the field, I would ex-
pect to eventually have complete satu-
ration in the backfill material. As such,
this lengthened response time may be
a factor of the laboratory testing, and
not a factor in field installations. This is
supported by the fact that the VWP in-
stalled tip down (which may have cap-
tured additional air) had a larger (but
still only 120 second) response time to
the increase in pressure.
I tested the difference between in-
stalling the VWP diaphragm up and
diaphragm down in grout in tests 6
and 7. These tests had very similar re-
sults. The VWP installed diaphragm
down took twice as long to respond
to increases in pressure. However, the
Figure 2. VWP installation diaphragm up, in water, without a
canvas bag.
Figure 3. VWP installed diaphragm up and down, in grout,
without a canvas bag.
Figure 4. VWP installed diaphragm up, in bentonite clay,
without a canvas bag.


