Geotechnical News • September 2015
25
WASTE GEOTECHNICS
VBA (Visual Basic for Applications)
macros and FSConsol. Based on a
conceptual systems model of a tailings
system (Figure 1) the TMSim model
tracks the stocks (accumulation of
mass) and flows of mass (solids [min-
eral including both fine and coarse],
water and chemicals) throughout
the system. The conceptual model
incorporates mine plan data, extraction
process, various stages of dewatering
(including Stage 1 classification, Stage
2 pre-deposition dewatering and Stage
3 post-deposition dewatering) and an
impoundment material balance includ-
ing tailings, process water, construc-
tion material and capping materials.
A suite of sub-models were used to
represent these individual components
in the TMSim model environment.
Critical processes (such as con-
solidation rates, Stage 2 dewatering,
seepage, etc.) within each component
will dictate mass transfer between the
sub-models. A spreadsheet is used for
the data entry/interface for all model
inputs such as site properties, tail-
ings properties, mining and extraction
rates, environmental data and pertinent
management decision variables (i.e.
constraints on the system).
The user has the option to utilize
built-in functions and sub-models or
to implement their own models (i.e.
user defined models, UDF). The UDFs
can be simple or complex numerical
models, depending on the level of
detail available and objective of the
modeling. The decision logic required
to allow switching between dewater-
ing technologies and deposition points
must also be provided by the user.
TMSim was developed using a top-
down systems modeling approach,
keeping the “big picture” in focus.
Each of the individual sub-system
models can be constructed from pro-
cess-based, empirical or even qualita-
tive formulations based on tentative
relationships between parameters. The
challenge to the modeler is then to
apply the appropriate level of detail
that will result in a suitable engineer-
ing simulation that will satisfy the
objective of the model process.
To assess the management strategies
or to evaluate a particular technol-
ogy, the TMSim model provides the
following performance measures as
output:
• Available storage volume (in-pit,
impoundment, construction mate-
rial).
• Required impoundment storage
volume (for both solids and water).
• Available recycle water volume and
quality.
• Strength gain trajectories within the
deposit.
• Seepage rate to the environment
and its quality.
• Sensitivity/flexibility of disposal
option.
• Impacts on extraction.
• Interim model results such as flow
rates and solids/fines content that
can be used as input for transport
analysis (pipeline/pump).
Base metal mine scenario
For the initial validation of the TMSim
model, a base metal mine tailings plan
was modeled. The data used in the val-
idation was taken from an engineering
feasibility study. The complexity and
scale of the proposed tailings manage-
ment plan was deemed suitable for
the development and validation stages
of the simulation model structure and
components. The TMS for the base
metal mine operation includes thicken-
ers to dewater the non-plastic, sandy-
silt tailings to ensure the tailings are
non-segregating upon deposition. The
tailings are then deposited sub-aque-
ously and stored under a water cap.
Overburden is utilized to construct a
tailings impoundment structure that
is subsequently lined with a geomem-
brane.
A sample of the output from the
TMSim model is provided in Figure
2 and includes the required total stor-
age volume and tailings volume with
time. The solid lines represent the
TMSim model data, and the dashed
lines represent the mine site data sets.
As can be seen from the figure, at the
end of mine life, the mass balance for
the model reflects the mine site data
set sufficiently. The modeled total
volume in the tailings disposal facility
(TDF) deviated from the mine data
set by up to +/-5% over the life of
the mine. Upon inspection of the data
and the TMSim model, the difference
can be attributed to how the area and
stage volume/height were calculated
in TMSim versus the feasibility study
and not due to loss of mass in the
TMSim model.
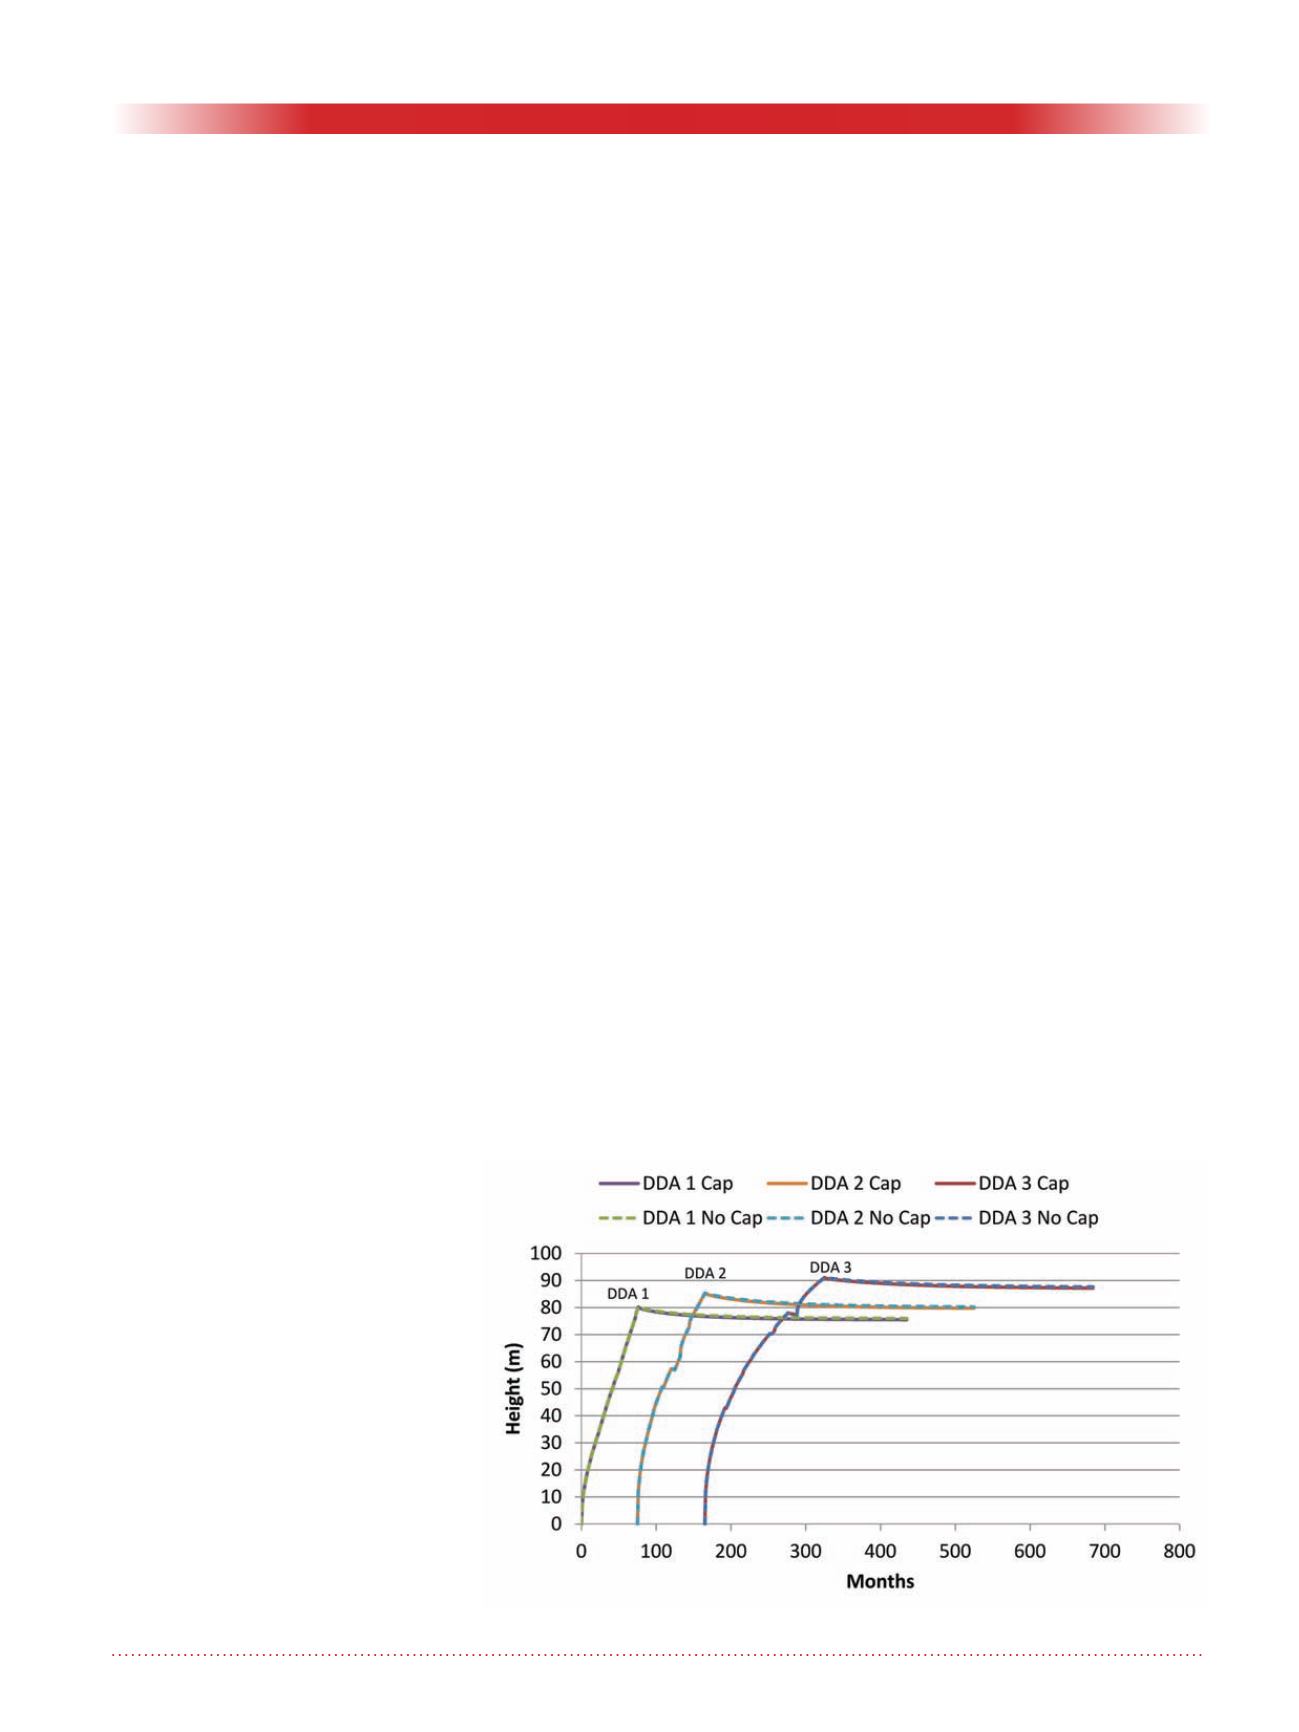
Figure 3. Total height of the CFF tailings deposits.


