Geotechnical News • September 2015
35
GEOSYNTHETICS
loose condition, flushing the specimen
with carbon dioxide in order to expel
oxygen and other gases in the per-
meameter, and then slowly filling the
specimen with water (50mm/hr). The
specimen should be kept in a no-flow
condition overnight to ensure com-
plete saturation.
In principle, the ASTM D 5101 gradi-
ent ratio test device (shown with an
additional top loading assembly in Fig.
1) provides an attractive method for
assessing soil-geotextile compatibility
because the candidate geotextile is
tested against the soil to be protected,
water is permeated through the sys-
tem, and any potential for clogging or
piping is evaluated directly. Interpreta-
tion of the gradient ratio test is based
on measurements of head loss that
occur in the soil and across a 25 mm
thick zone adjacent to the geotextile
(GR
25
). Fannin et al. (1994a) intro-
duced an additional port 8 mm above
the geotextile (see Fig. 1), in order to
gain a more sensitive measure of head
loss in the soil-geotextile ‘bridging
zone’ that was termed the modified
gradient ratio (GR
8
). The benefit of
adopting such an additional measure-
ment close to the geotextile is now
well-recognized (see for example,
Austin et al., 1997; Palmeira et al.,
2005).
Reproducibility of the test is very
dependent on achieving full satura-
tion of the reconstituted soil speci-
men. Fannin et al. (1994a and 1994b)
established an alternative means to
reconstitute homogeneous saturated
specimens, by means of water pluvia-
tion for uniformly graded soil and by
slurry deposition for broadly graded
soil. The specimen is leveled by
siphoning and, if appropriate, densi-
fied by light tapping with a soft ham-
mer. Preliminary testing identified the
need for adding a commercial liquid
algaecide to inhibit biological growth,
a finding that was further confirmed by
Fischer et al. (1999).
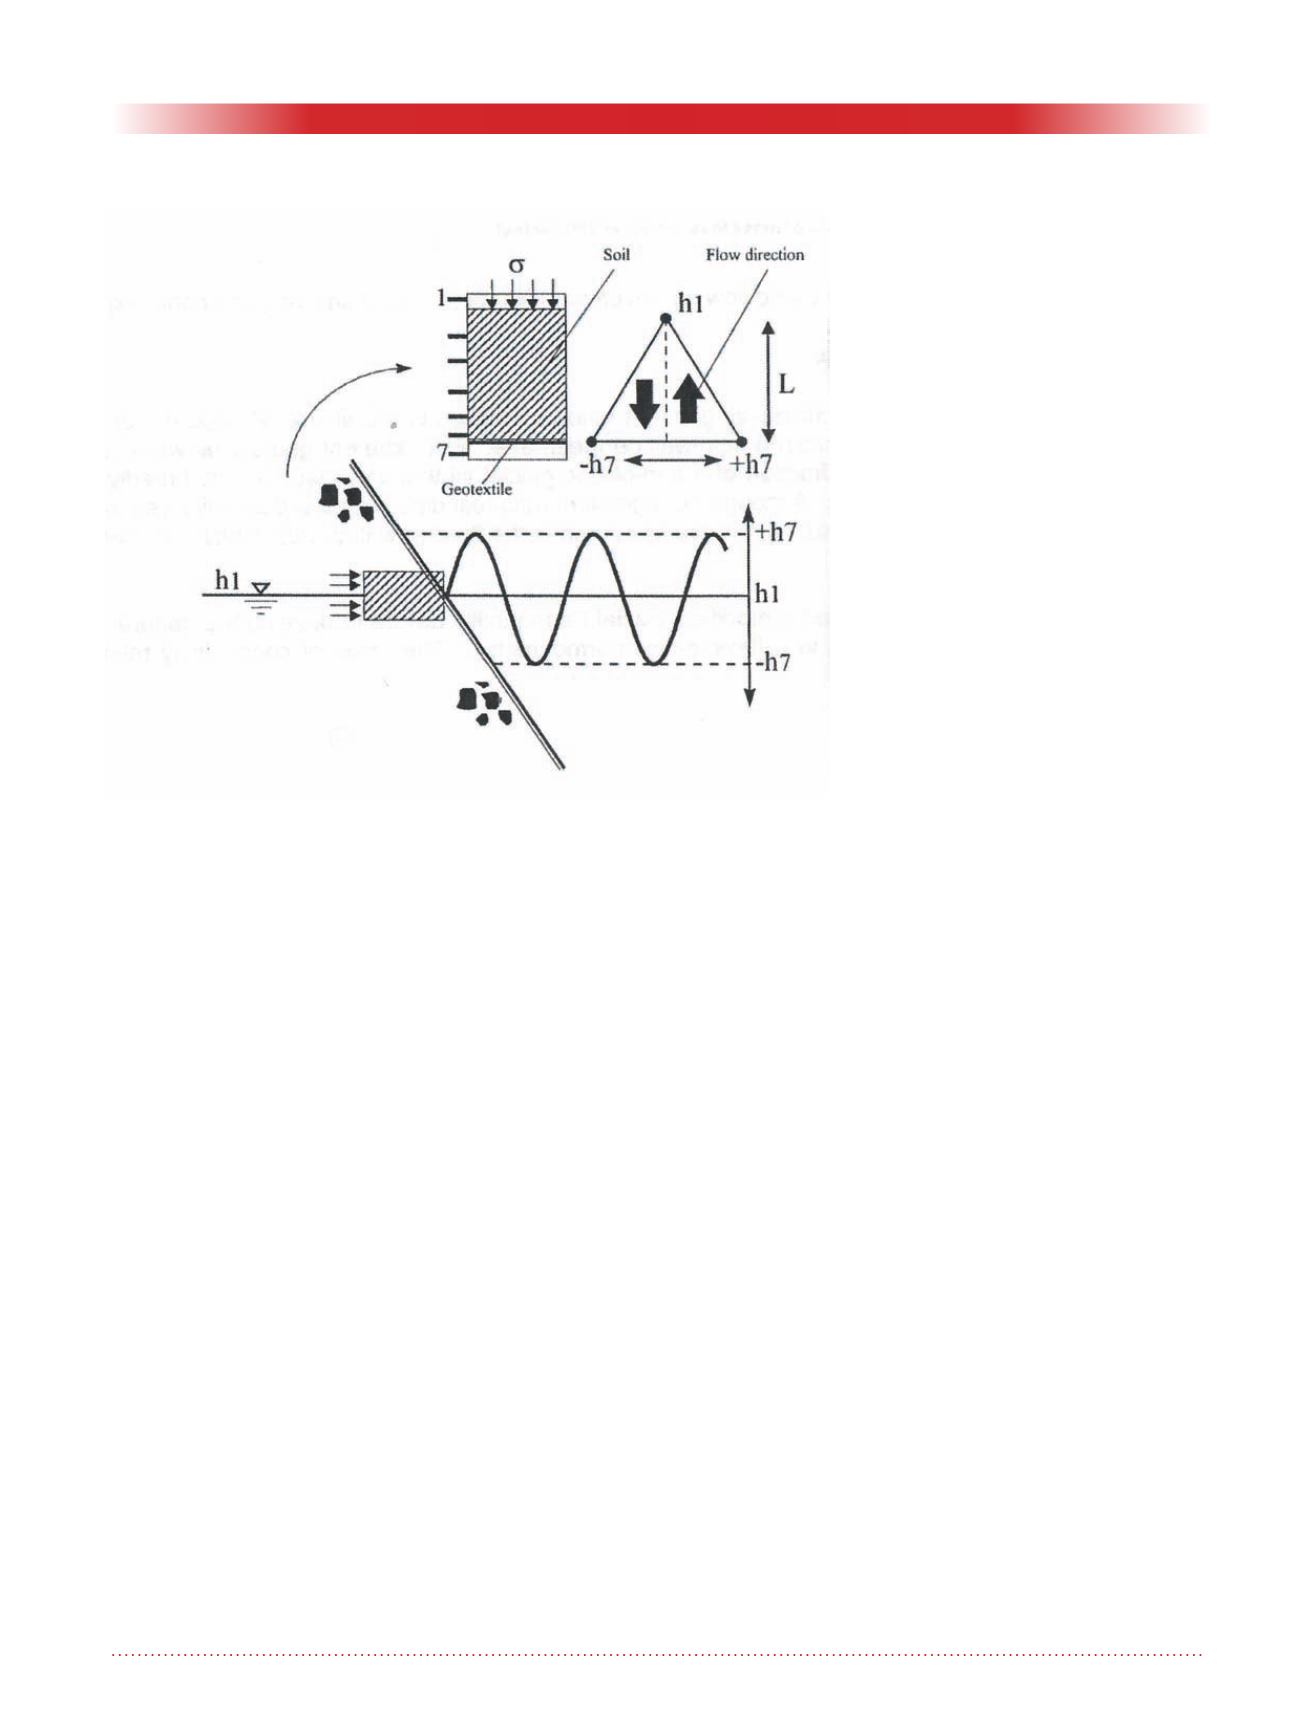
A conceptual illustration of the
approach to modeling cyclic flow in
a laboratory element test is illustrated
in Fig 3. Hameiri and Fannin (2002)
describe a modified gradient ratio test
device that was configured to impose
cyclic flow using head control, while
maintaining the ability to apply axial
load and collect soil passing through
the geotextile. Fannin and Srikongsri
(2007) report data using the same
device that show mass loss is sensi-
tive to confining stress and the period
of flow reversal, both of which are
believed to exert a significant influ-
ence on the ability of a bridging
network to develop in the base soil
adjacent to the geotextile. Extend-
ing the database of results to include
combinations of 9 different geotextiles
and 6 cohesionless soils (with 0.6 ≤
O
95
/D
85
≤ 2.8), Srikongsri and Fannin
(2009) examined factors controlling
soil retention by means of multi-stage
tests, based on the observed relation
between O
95
/D
85
and rate of mass loss
(g/m
2
per 100 cycles). No combination
of uniformly graded soil (C
U
< 2) and
nonwoven geotextile yielded a mass
loss for O
95
/D
85
≤ 2.25. Similarly, no
combination of uniformly graded soil
(C
U
< 2) and woven geotextile yielded
a mass loss for O
95
/D
85
≤ 2, however
a significant loss was encountered for
2.5 < O
95
/D
85
. In all cases the onset of
soil loss occurred at retention ratios
significantly greater than the empiri-
cal rule of O
95
/D
85
≤ 0.5 that has been
advocated for design (Holtz et al.,
1997). Likewise, by inspection, it can
be inferred that the onset of soil loss
occurred at retention ratios greater
than O
90
/D
90
≤ 0.5 to 1 that has also
been advocated for design (Schiereck,
2003). Accordingly, the empiri-
cal design rules for soil retention in
reversing flow appear very conserva-
tive.
Harney and Holtz (2001) report details
for a flexible-wall gradient ratio test
device that Bailey et al. (2005) then
used to compare with results obtained
using the standardized rigid-wall per-
meameter. Five different geotextiles
were examined in testing, in combi-
nation with the 2mm-minus fraction
of a non-plastic glacial till that was
classified as broadly-graded, gravelly,
silty sand, and each test was repeated.
Figure 3. Principle of the cyclic gradient ratio test.


