22
Geotechnical News • June 2016
GEOTECHNICAL INSTRUMENTATION NEWS
the project designer, coming from a
geotechnical or civil engineering back-
ground. The quality of the monitoring
service is significantly increased when
what is being measured is understood.
See Figure 2.
QA/QC
Rule number 7: Ensure quality
control on the measurements, and
actively maintain the monitoring
systems.
First, instruments must be installed
properly. For many instruments, poor
quality of installation will render
future measurements impossible or
will deliver very poor quality data.
Ideally “final control sheets” are put in
place, which list, for each instrument,
the quality control to be carried out.
When possible the control consists of
applying a known variation to what is
being measured, and checking on the
final output (the report or the moni-
toring database screen) whether the
variation is correct. It is surprising
how many mistakes can be detected
using this method. Typically, these
include factors of 10 or 1000, inverted
axes, etc.
After installation comes the monitor-
ing. Many clients question the reason
for having the expense of data manag-
ers and data control on site. A common
comment is “the instruments are auto-
matic, so you do not need anybody on
site”. But without
continuous
quality control,
the systems,
whether manual
or automatic,
will quickly drift.
Such control can
be automatic
though data anal-
ysis algorithms,
but human brain
power is also
necessary. Data
managers analyse
the alarms and
conduct corrective actions if neces-
sary, they check the manually acquired
data, and they are in charge of car-
rying out detailed quality checks on
selected instruments.
Finally, depending on the accepted
level of risk, sufficient spares parts
and redundancy must be provided and
included in the budget.
Data to information
Rule number 8: Include added value
tools to maximize the use of the
monitoring data.
The primary deliverable of any moni-
toring system are valid measurement
data. This is a major achievement in
itself. But the next question to address
is: how can the usefulness of the
monitoring data be maximised for the
users, considering that data are useless
if not understood?
With this objective in mind, all the fol-
lowing are important features:
• Data integration (all data, from all
sources, in a single system)
• Data fusion (cross correlation of in-
formation from different sources)
• Alarm velocity and data velocity
(rapid delivery of the alarm and
rapid analysis of its causes)
• Alarm management (acknowledge-
ment, by whom, why, etc.),
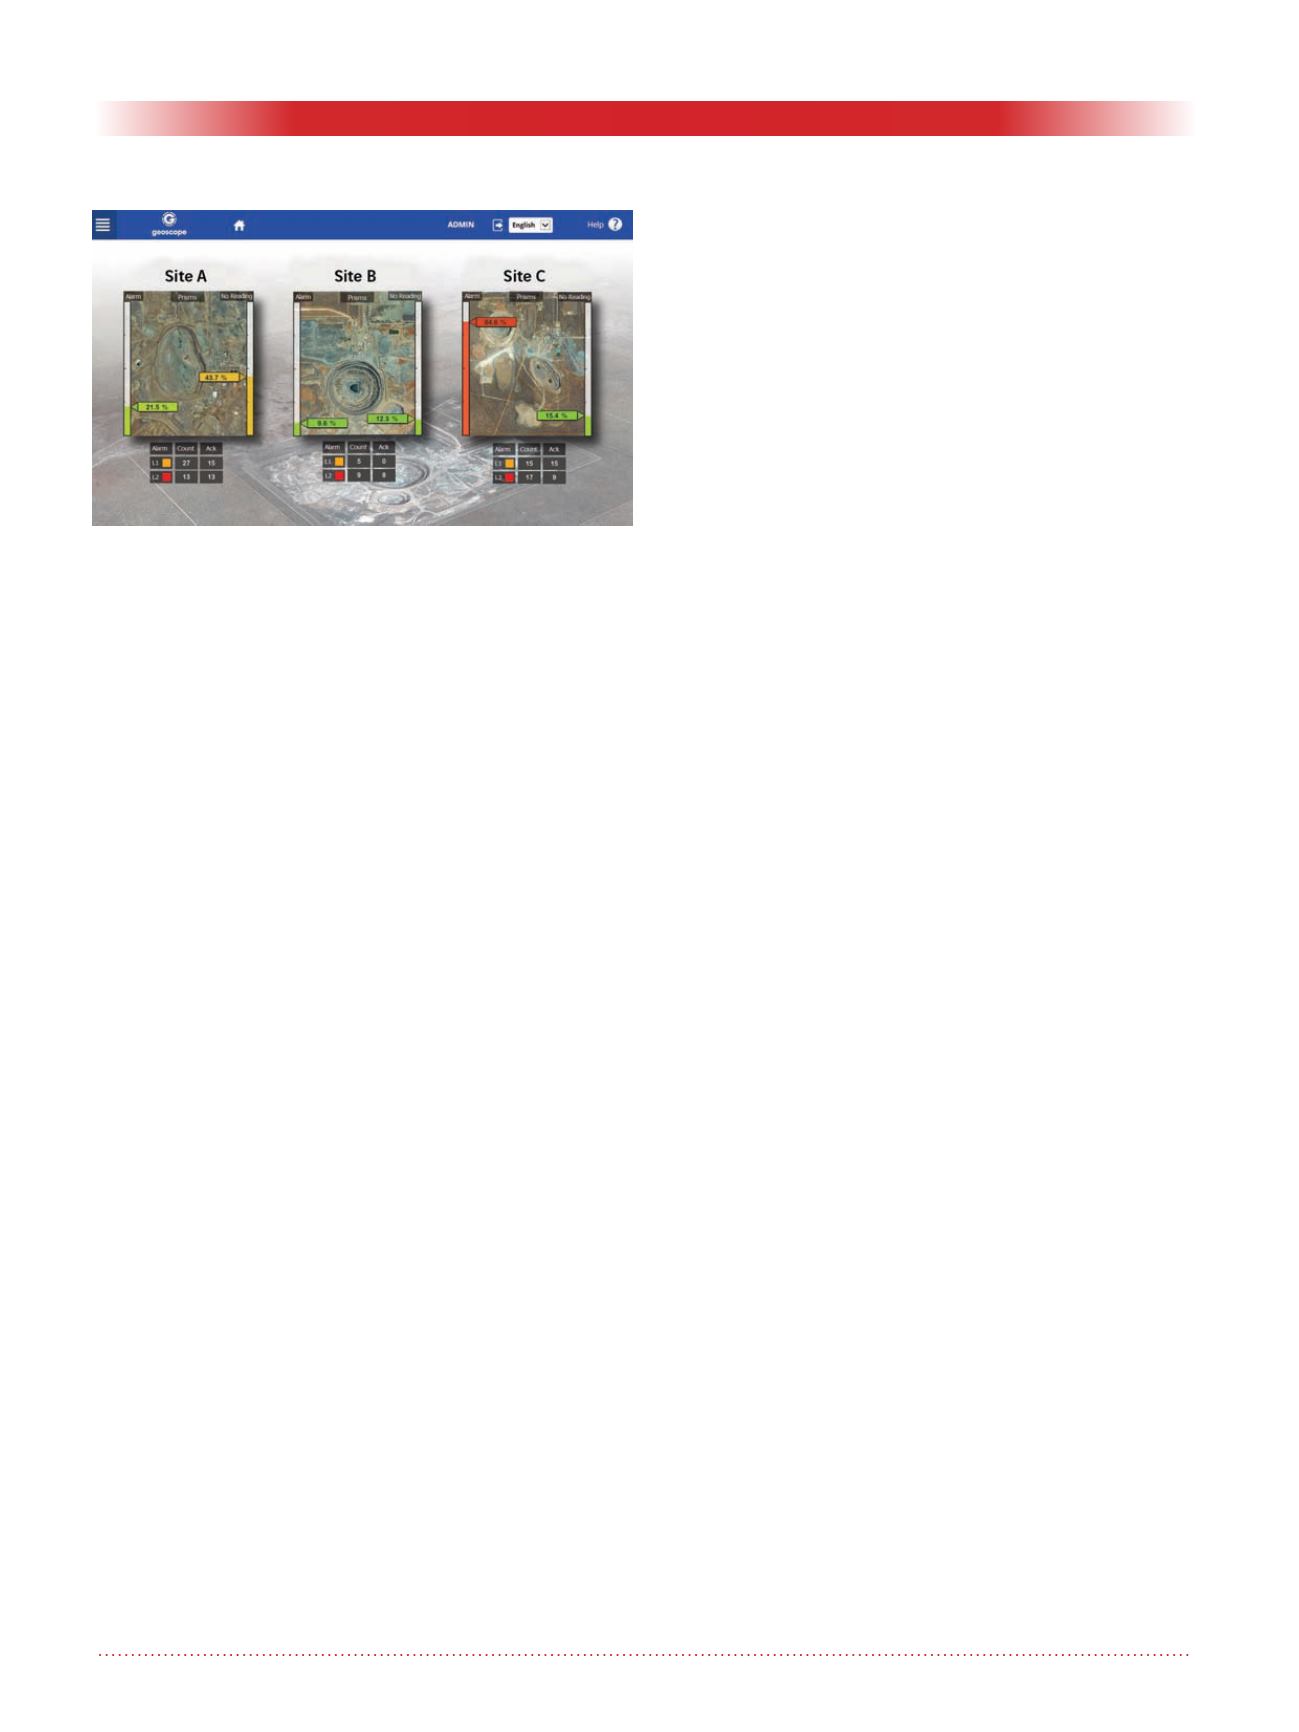
• Weather map approach or dash-
board. This is the ability to display
in a very simple and effective way
a huge volume of more or less
complex data, so one can under-
stand what’s going on at a glance,
in a similar way to a meteo map on
your TV screen summarizing the
calculations of some of the biggest
computers on earth. See Figure 3
for example, where three sites are
summarized on one page, show-
ing for each site the number and
percentage of sensors not reading
(for example disconnected if au-
tomatic, or the planned frequency
is not respected if manual), the
number and percentage of alarms
of type 1 and type 2 (count L1
and count L2), and the number of
alarms that have been acknowl-
edged (i.e. controlled and com-
mented by an operator). The colors
of the squares and side bars help to
understand at a glance the status at
the monitoring site.
• Journal (the monitoring system
records a journal of internal or
external events that is presented
alongside the data to help the
analysis)
Conclusion
The factors influencing the suc-
cess, partial failure, or total failure
of a monitoring project are numer-
ous, starting from the design phase,
through to procurement of the
monitoring contractor, installation of
the instruments, to data collection,
pre-analysis, data presentation and
reporting.
Martin Beth,
Soldata Group
3120 Route d’Avignon,
13 090 Aix en Provence
France.
Tel +(33) 4 42 21 72 11
E-mail:martin.beth@soldatagroup.
com
Figure 3. Weather map approach: “board” showing a
summary of three sites on one page.


