38
Geotechnical News • June 2018
WASTE GEOTECHNICS
how this may be expected to vary over
the mine life, the nature of the tailings
particularly their clay mineral content
and type, the initial solids concentra-
tion of the tailings on disposal, and the
behaviour of the tailings on deposi-
tion. The extent of consolidation of
the tailings will depend on the rate
of rise and nature of the tailings, and
will also be affected by the geometry
of the TSF. The climate will dictate
the potential for desiccation of the
tailings, with the geometry of the
tailings dam and storage facility also
influencing desiccation. The extent of
desiccation of the tailings will depend
on the clay mineral content and type,
and the related initial solids concentra-
tion of the tailings, the deposited layer
thickness, and the cycle time between
layers. The settling from a slurry state,
self-weight consolidation and desicca-
tion of a particular tailings can inform
effective tailings disposal and storage
design.
Instrumented column testing of
tailings
The results of instrumented column
testing of the settling, self-weight
consolidation and desiccation of a par-
ticular tailings can be used to optimise
tailings deposition layer thickness
and cycle time, and hence the TSF
footprint for a given tailings produc-
tion and type.
Description of instrumented column
The column developed at The Univer-
sity of Queensland (UQ) is manufac-
tured from readily available 200 mm
diameter Perspex or PVC tubing.
The height of the column is 1.2 m,
comprising two or three sections to
facilitate filling and dismantling of the
column, and with an additional section
or sections used to contain the tailings
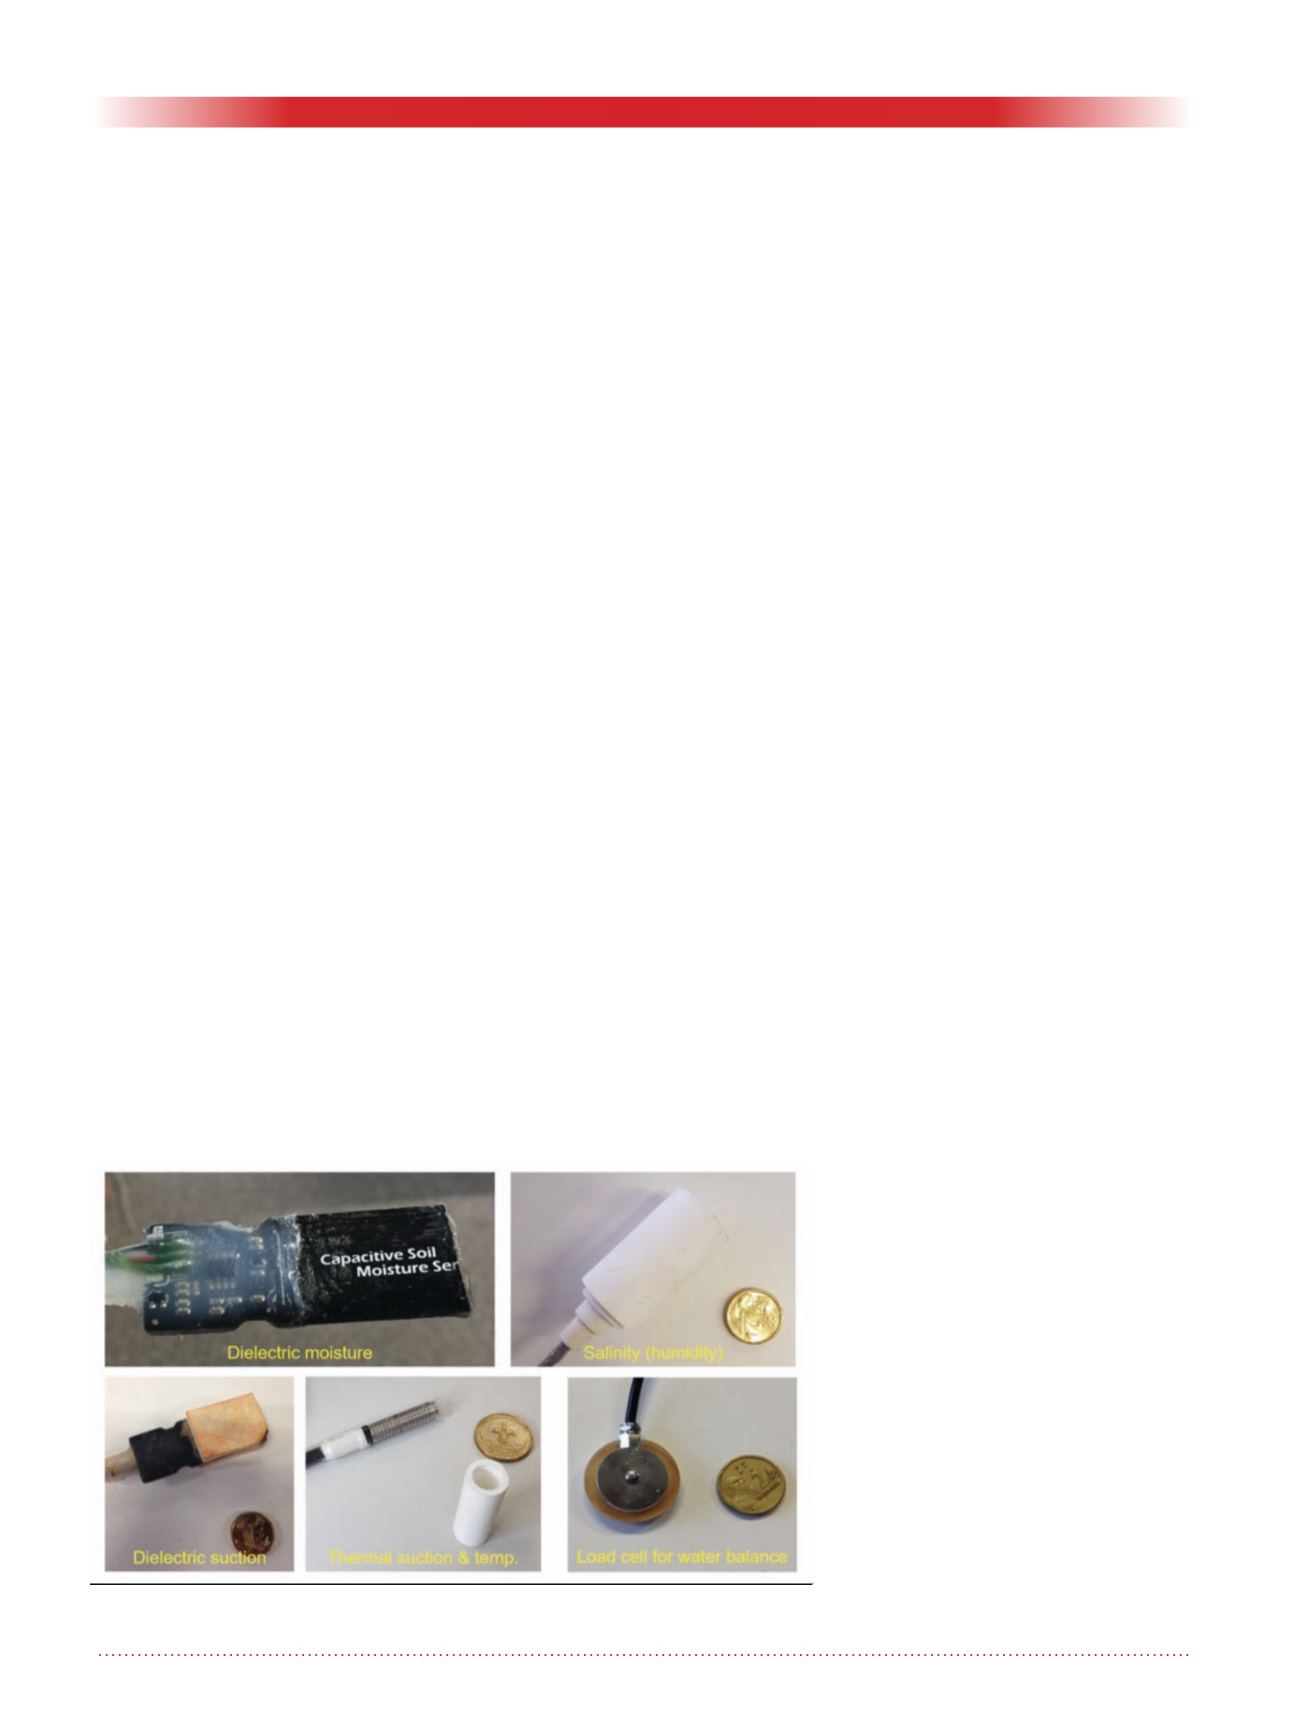
placed as a slurry. The column may
be cost-effectively instrumented down
its height with up to 10 of each of
moisture, matric suction, temperature
and salinity sensors manufactured at
UQ, together with base load cells to
record the water balance, and a data
logger with open-source software that
downloads data via the internet. The
developed sensors are shown in Figure
1.
Tailings tested
The tailings tested were iron ore sand
tailings and slimes. The sand tailings
comprised about 50% fine to medium-
grained sand-sized particles, 48%
silt-sized particles and 2% clay-sized
particles, classifying them as a Silty
SAND. The slimes comprised about
75% silt-sized particles and 25% clay-
sized particles, with a Liquid Limit
of 28.1%, a Plastic Limit of 13.5%,
a Plasticity Index of 14.6%, and a
Linear Shrinkage of 5.0%, classifying
them as a Clayey SILT of low plastic-
ity (ML). The specific gravity of the
sand tailings is 2.85 and that of the
slimes is 3.86. Both slurries have a pH
of about 7.6, and an electrical conduc-
tivity of about 500 µS/cm.
The sand tailings and slimes are
discharged at solids concentrations of
40% and 25% by mass, respectively.
On settling in a 1,000 cc measuring
cylinder the sand tailings and slimes
achieved 71% (gravimetric moisture
content of 40% and dry density of
1.33 t/m
3
) and 60% solids by mass
(gravimetric moisture content of 65%
and dry density of 1.10 t/m
3
), almost
instantaneously and in about 24 hours,
respectively.
Sample preparation
The column samples were prepared
at their initial solids concentrations
and added in 24 layers to separate
instrumented columns (two for the
sand tailings and two for the slimes) at
a high rate of rise equivalent to 16 m/
year. Each layer was left to settle and
consolidate for 24 hours before the
subsequent layer of slurry was placed.
Two of the columns, one filled with
sand tailings and the other slimes,
were tested in the laboratory, with
desiccation simulated using a 375 watt
infrared lamp mounted above the top
of the column. The other two columns
were tested on a rooftop at UQ and
exposed to ambient weather conditions
that were monitored using a weather
station.
Laboratory column results
The laboratory columns have been run
for over 120 days, and the results are
shown for the sand tailings and slimes
in Figures 2a and 2b, respectively. For
the sand tailings, three desiccation
stages are evident from the evapora-
tion rates in Figure 2a, and no crack-
ing was observed. An initial constant
evaporation rate of about 4.7 mm/
day lasted for about 10 days. The
evaporation rate decreased from days
10 to 70, and the last stage beyond
day 70 showed a roughly constant
evaporation rate of about 0.3 mm/day.
Matric suctions developed in the sand
Figure 1.
Sensors developed and manufactured at UQ from instrumented
column.


