44
Geotechnical News • March 2012
here except that it shows the differ-
ence the orientation of a piezometer’s
sensor can make to the reading. If the
sensor confronts the flow the velocity
head will register, otherwise it will not
be seen.
The bottom sketch was constructed to
make as clear a comparison as I can
between the pressure losses of seepage
and the pressure gains of motion. In
this case I’ve used the oedometer as
the laboratory equivalent of relative
motion between the phases. Refer-
ring back to the free-body diagram
in Figure 16 we see that relative
movement between the phases results
in hydrodynamic pressures being
generated across the particle diameter:
This constitutes an elemental hydrau-
lic gradient. If we now consider the
sequence of adjoining particles within
a soil-structure we can appreciate that
what results is in effect a continu-
ous potential gradient. This, like the
seepage gradient, is a vector, and the
“motion head” will register on a sen-
sor only to the degree that this vector
is orthogonal to the sensing face.
The basic difference between the two
sketches is that instead of the motion
gradient being externally imposed, as
is the case for steady state seepage,
this gradient is built up from within,
by virtue of the forces imposed on
the water by the moving solids, one
particle after another. In both cases the
gradient increases upstream.
The real value of this comparison
is to justify the assumption made in
EPWPGRAD, and that is that the rela-
tive motion velocity used to compute
the viscous and pressure component
forces is equal to the approach veloc-
ity used in computing the Seepage
Force. This becomes apparent once
the velocities at the left hand side
boundary of both top and bottom soil
elements are compared.
Practical implications
If this new way of accounting for
pore water pressure has any value
then it should be able to give us some
practical help in the various aspects of
geotechnical engineering practice.
Laboratory
My views on the undrained tri-
axial compression test have been
expressed already. As I see it, the
intrinsic mechanical problem with this
device, and the impression it gives
that increasing pore water pressure
leads to failure, is that within a sealed
membrane, with no place for the
water to flow, there is no possibility
of a hydraulic gradient existing – the
water potential is short-circuited. Here
I am referring to things at the speci-
men and sensor scale. Of course at the
microscopic scale, water must flow
around individual particles as they are
shuffled around, but the pressure sen-
sor itself shorts these out.
In both the permeameter and the
oedometer water is allowed to flow,
and so there is no conceptual difficulty
with regard to hydraulic gradients.
Here it would be of interest to know
the pressure distribution within the
specimens. That would be a check on
the notion that for smaller particles
undergoing slow deformation the
viscous component should predomi-
nate, thus reducing the measurable
pressure component accordingly. And
in consolidation testing, what if the
particles are small enough that the
only resisting force to motion is the
viscous component? Would the motion
be controlled by viscous creep rather
than by seepage flow?
Site investigation
The CPT probe penetrates the ground
at a rate of 20 mm/s, recording the
pore pressures caused by the cavity
expansion straining at the tip. A typi-
cal trace of these on-the-run dynamic
pore pressure responses [Bq] shows
large swings from positive to negative
Bq as the cone passes through contrac-
tive and dilative strata. A particular
type of trace, which I have heard
people call “hydrostatic”, and is at first
sight puzzling, presents a challenge to
the hypothesis being advocated here to
find an explanation.
These “hydrostatic” traces are appar-
ently quite common in the sands of the
Fraser River channel/delta. The name
comes from the fact that the dynamic
pore pressures follow a straight line
coincident with the open water pres-
sure line. In other words, the cavity
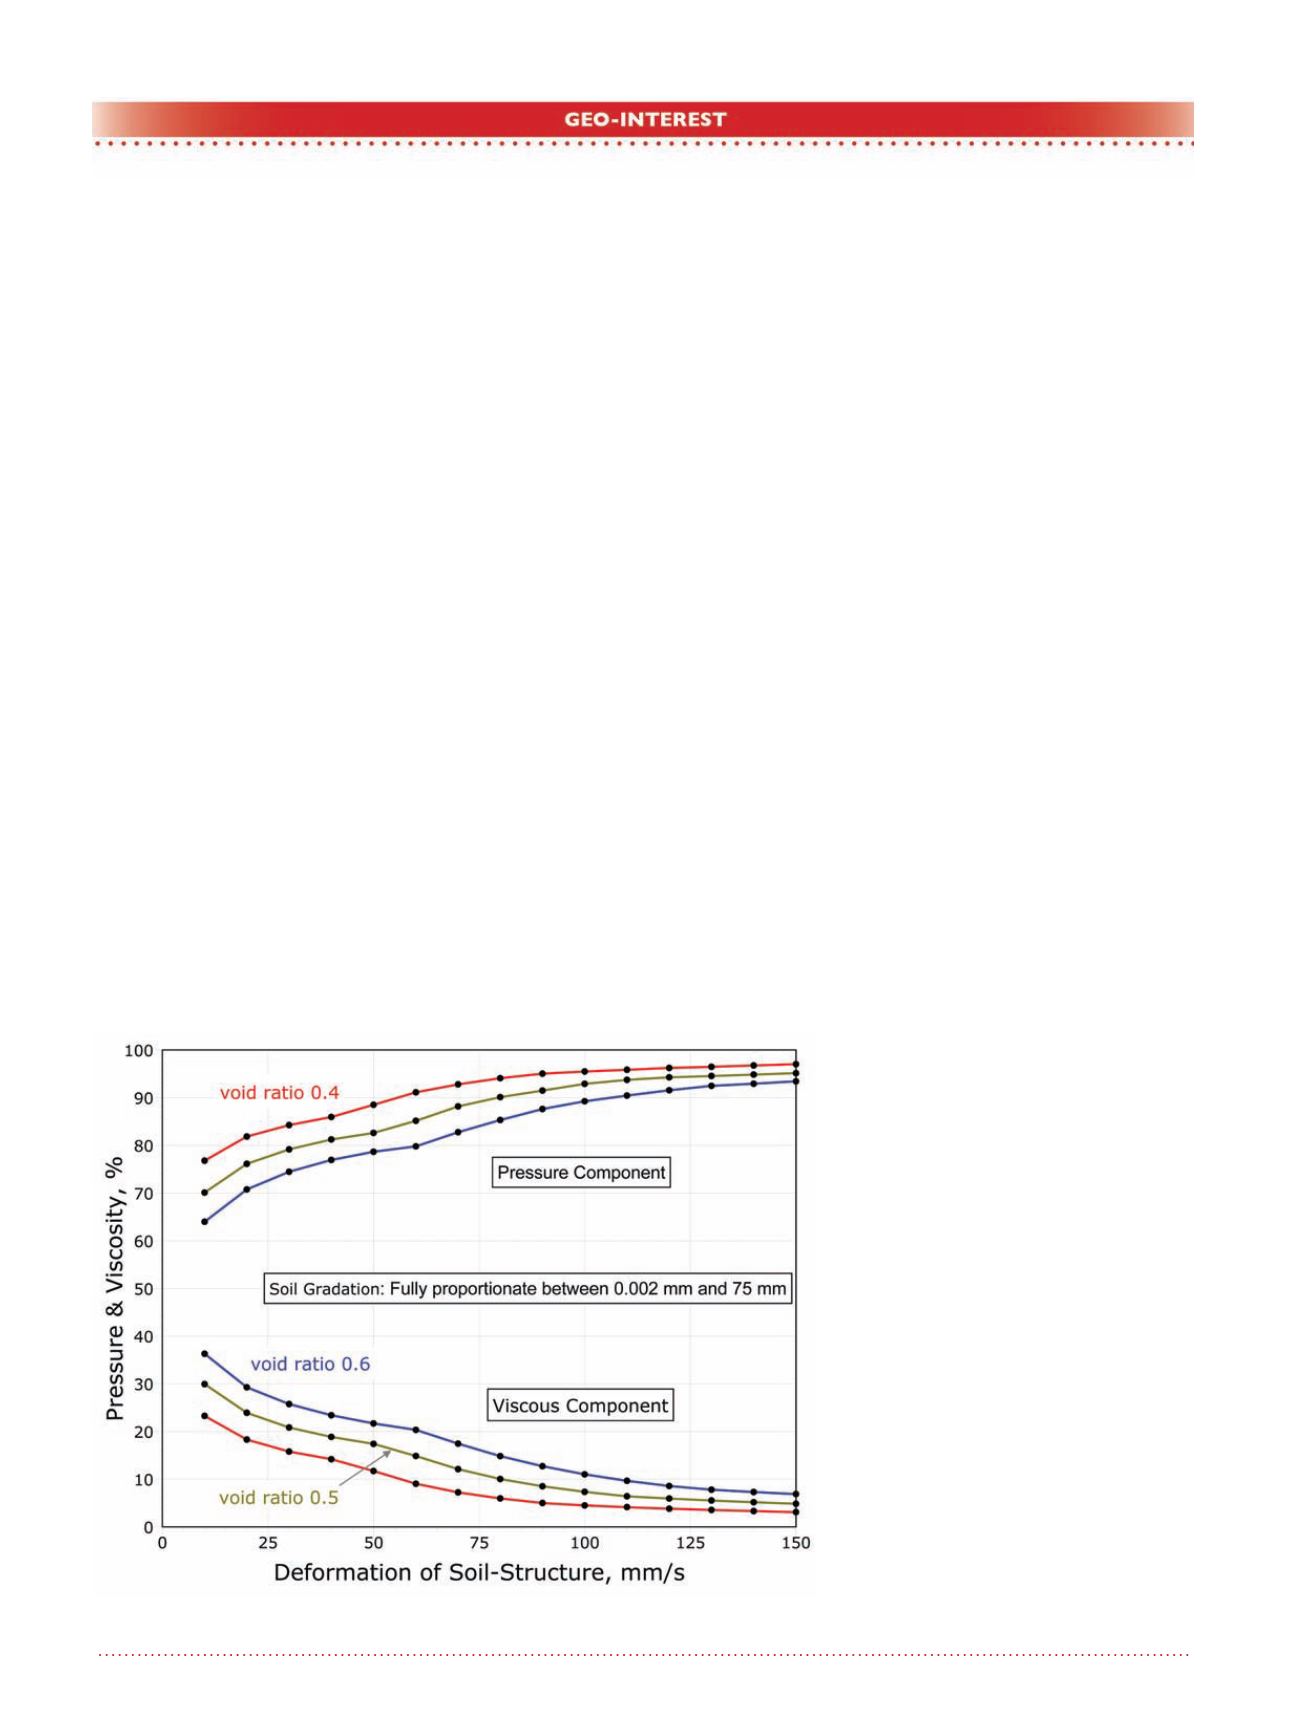
Figure 18. Pressure & viscosity % v. soil-water relative motion.


