52
Geotechnical News • December 2015
WASTE GEOTECHNICS
Results and discussion
Water balance
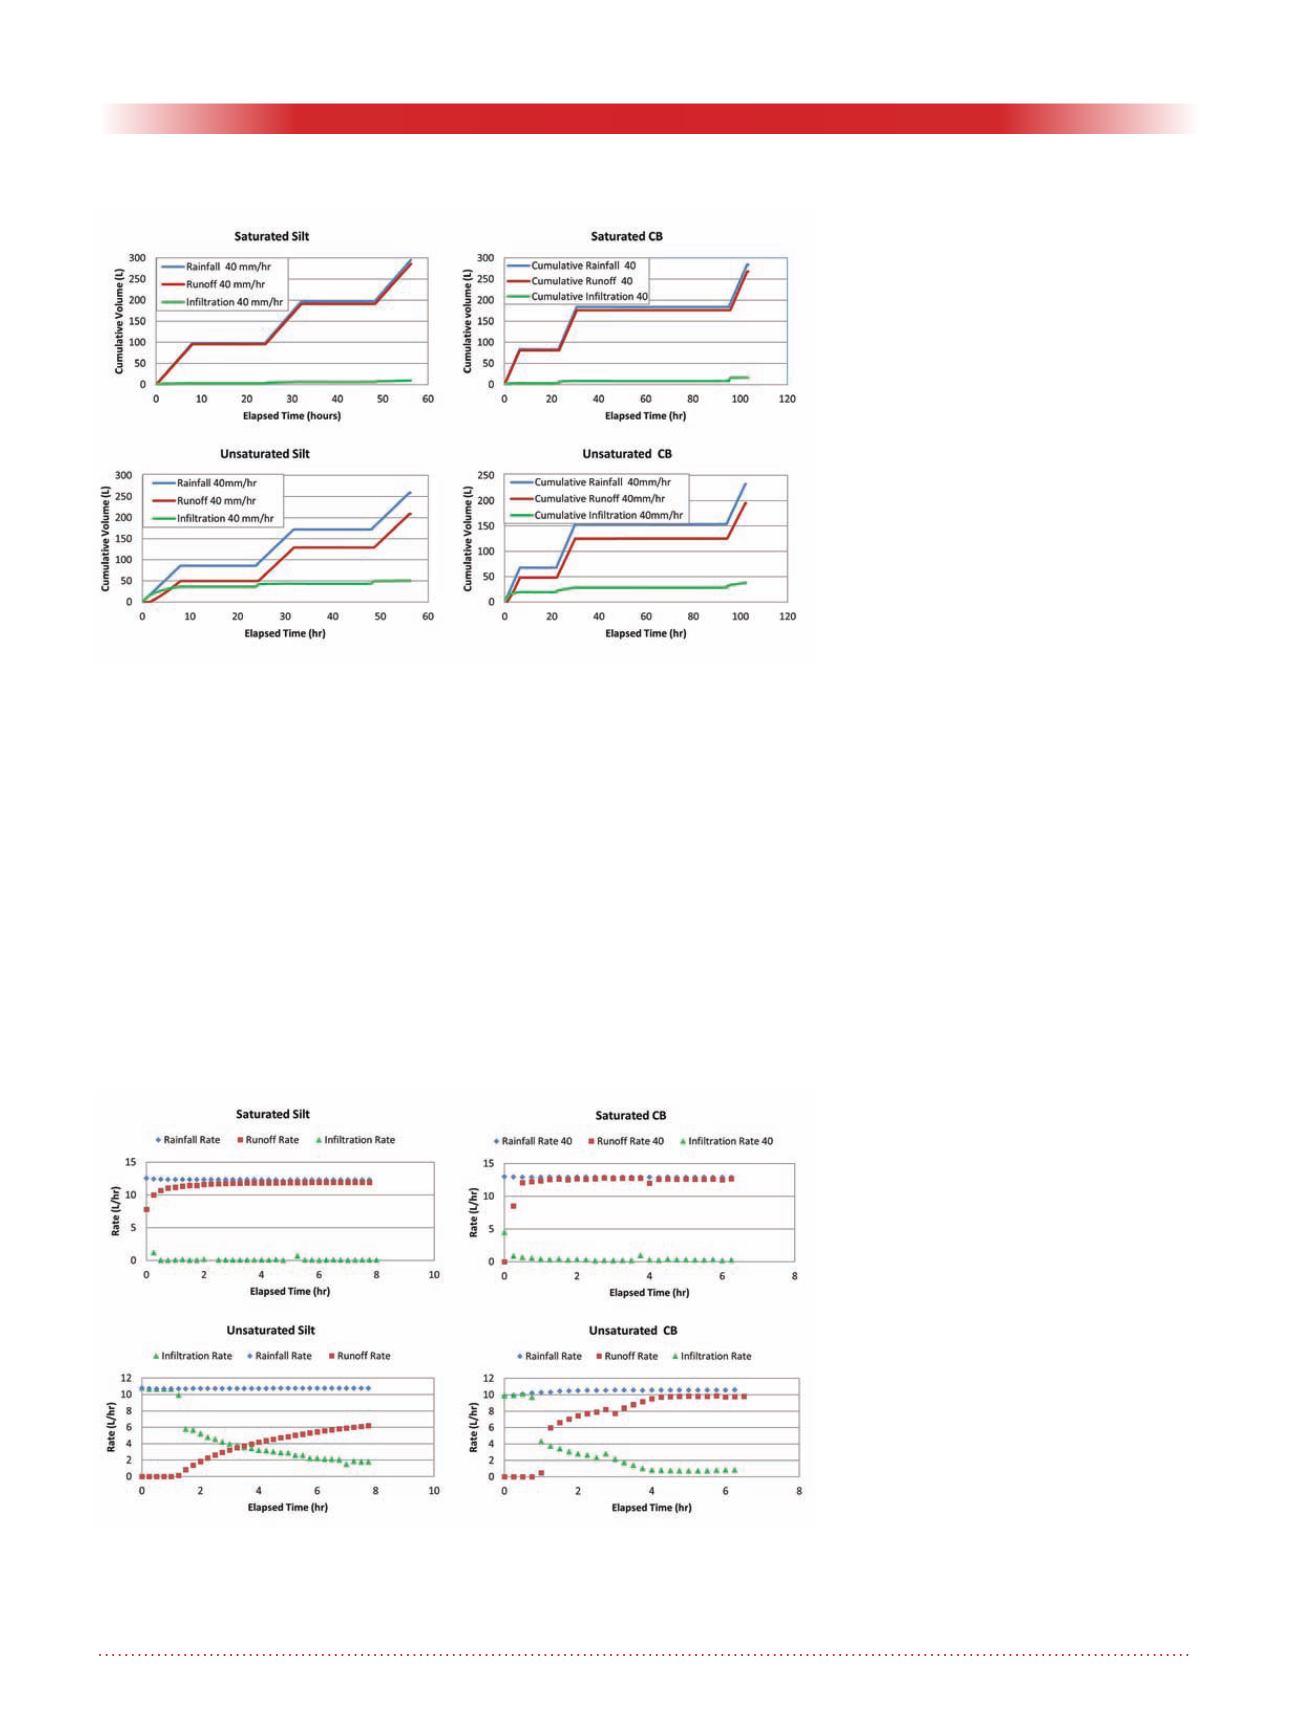
Typical measured components of
water balance versus time are pre-
sented in Figure 2. In the saturated
silt profiles, results suggest that about
95%-98% of the entire applied rainfall
volume eventually converted into
runoff with very little infiltration.
Akin observations were made in the
saturated capillary barrier profiles,
although with higher infiltration at
higher applied rainfall intensities.
Naturally, lower percentages of runoff,
and higher infiltration were observed
in the unsaturated profiles. In the
unsaturated silt profiles, between
60-80% of the applied rainfall
eventually converted into runoff. The
increase in runoff percentage was
found to be directly proportional to the
increase in precipitation rate.
In contrast to the unsaturated silt
profiles, higher percentages of runoff
were observed in the unsaturated
capillary barrier profiles. Measured
cumulative runoff volumes ranged
between 70%–80% of the overall
applied rainfall. Similarly, the increase
in runoff percentage was directly
proportional to the increase in precipi-
tation rate.
Rate statistics
Typical variation in rainfall, runoff
and infiltration rates with time are
illustrated in Figure 3 In the satu-
rated silt profiles, the infiltration rate
remained virtually unchanged as time
progressed during each test, as long as
the applied rainfall intensity remained
constant, indicating a single soil
property controlling the infiltration,
thus runoff in the saturated profiles
scenario. This observation proved true
in all of the experiments of various
precipitation rates. Increasing the
applied rainfall intensity marginally
increased the infiltration rate. Simi-
larly, the runoff rate remained constant
with time throughout each test, and
demonstrated an accordant increase
with the increasing applied rainfall
intensity. This amounts to runoff being
controlled primarily by the applied
rainfall intensity and the saturated
hydraulic conductivity of the soil for
the case of saturated soils.
Conversely, in the unsaturated
realm, the infiltration rate decreased
non-linearly with time in both silt
and capillary barrier scenarios in a
consistent manner with the infiltra-
tion capacity function of the soil. The
runoff rate followed suit though in an
inverse path, where it increased non-
linearly with time during each test,
and increased from one set of tests to
the other in accord with the increase in
applied rainfall intensity. This sug-
gests that the controlling parameters
in the case of unsaturated soils are the
applied rainfall rate and the infiltration
capacity of the soil.
Figure 2. Typical measured components of water balance versus time in the
saturated silt profiles (top left), saturated capillary barrier profiles (top right),
unsaturated silt profiles (bottom left) and unsaturated capillary barrier pro-
files (bottom right) at 40 mm/hr rainfall intensity.
Figure 3. Typical measured rate of precipitation, runoff, and infiltration versus
time in the saturated silt profiles (top left), saturated capillary barrier profiles
(top right), unsaturated silt profiles (bottom left) and unsaturated capillary
barrier profiles (bottom right) at 40 mm/hr rainfall intensity.


